> ## Documentation Index
> Fetch the complete documentation index at: https://help.dingtalk.io/llms.txt
> Use this file to discover all available pages before exploring further.

# 漏斗图

> 仪表盘漏斗图清晰展示业务流程各阶段数据与转化率，支持普通漏斗/转化漏斗两种类型及逐层累计统计，适用于市场营销、销售管理和用户行为分析中快速定位流程瓶颈。

漏斗图能够清晰地展示业务流程中**各个阶段的数据及其转化情况**。在市场营销、销售管理以及用户行为分析等场景中，漏斗图可以直观地呈现各环节之间的转化率，从而帮助你快速发现流程中的瓶颈或问题点。

## 添加漏斗图

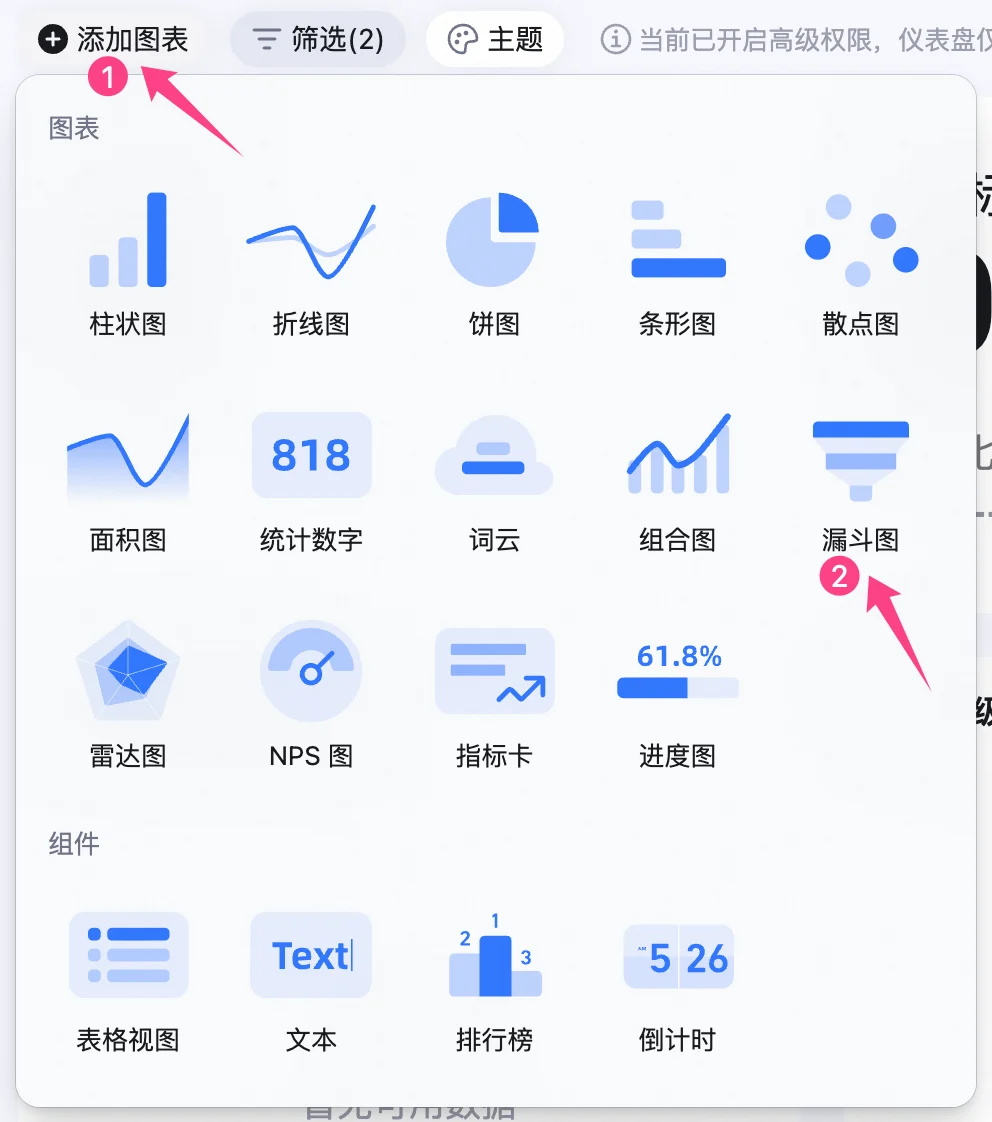
在仪表盘左上角点击  **添加图表** ，在弹窗菜单的图表类型中选择 **漏斗图** 。

<img src="https://mintcdn.com/dingtalk-8c0f98e2/YwlxKh9vB2sYUnZ_/zh/aitable/dashboards/dashboard-components/funnel-chart/images/image_OVwINRyaDM.png?fit=max&auto=format&n=YwlxKh9vB2sYUnZ_&q=85&s=292b29e203303fd4683b3d4f3188ddbb" alt="" width="992" height="1122" data-path="zh/aitable/dashboards/dashboard-components/funnel-chart/images/image_OVwINRyaDM.png" />

## 配置漏斗图

对类型与数据和自定义样式进行配置：

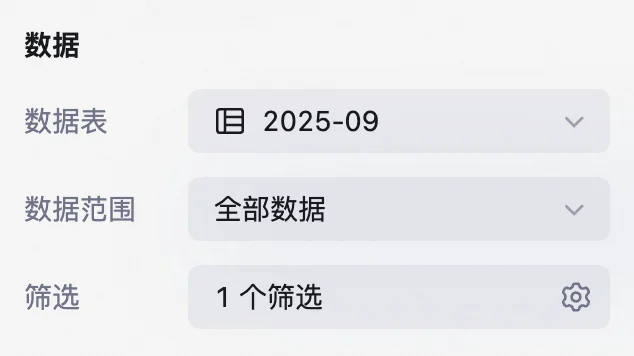
**数据：** 支持选择数据来源，包括数据表、数据范围，当数据范围选择**全部数据** 时，支持设置筛选条件。

<img src="https://mintcdn.com/dingtalk-8c0f98e2/YwlxKh9vB2sYUnZ_/zh/aitable/dashboards/dashboard-components/funnel-chart/images/image_So4XuHY1RX.png?fit=max&auto=format&n=YwlxKh9vB2sYUnZ_&q=85&s=7093c75fd9010ae445b53154d4dc7b2a" alt="" width="634" height="356" data-path="zh/aitable/dashboards/dashboard-components/funnel-chart/images/image_So4XuHY1RX.png" />

**图表：** 支持切换图表配色。

<img src="https://mintcdn.com/dingtalk-8c0f98e2/YwlxKh9vB2sYUnZ_/zh/aitable/dashboards/dashboard-components/funnel-chart/images/image_M_x6bX07bG.png?fit=max&auto=format&n=YwlxKh9vB2sYUnZ_&q=85&s=df6e41d85b4fbddc9ce8c8c5d9e1d72c" alt="" width="630" height="168" data-path="zh/aitable/dashboards/dashboard-components/funnel-chart/images/image_M_x6bX07bG.png" />

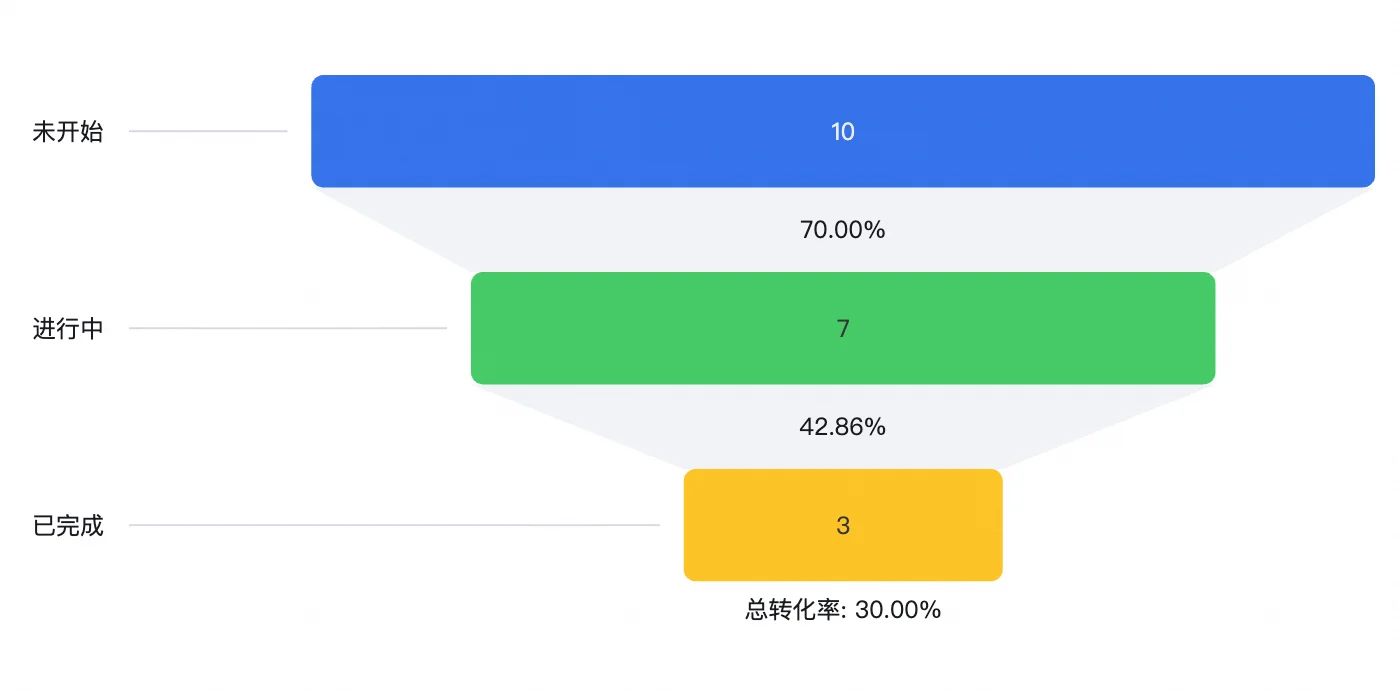
**漏斗类型：** 选择普通漏斗或转化漏斗，普通漏斗不会计算转化率和总转化率。

<img src="https://mintcdn.com/dingtalk-8c0f98e2/YwlxKh9vB2sYUnZ_/zh/aitable/dashboards/dashboard-components/funnel-chart/images/image_ZGfOaBg0Qx.png?fit=max&auto=format&n=YwlxKh9vB2sYUnZ_&q=85&s=b30f5acac5fbdd27c58ca2165fd2c6c2" alt="" width="1398" height="690" data-path="zh/aitable/dashboards/dashboard-components/funnel-chart/images/image_ZGfOaBg0Qx.png" />

**转化率：** 漏斗中一个环节与其前一环节数据的比值。例如，在上图中，“最下面一层”的值为 3，“第一层”的值为 10，因此从第一个环节到最后一个环节的转化率为 3/10，约等于30.00%。

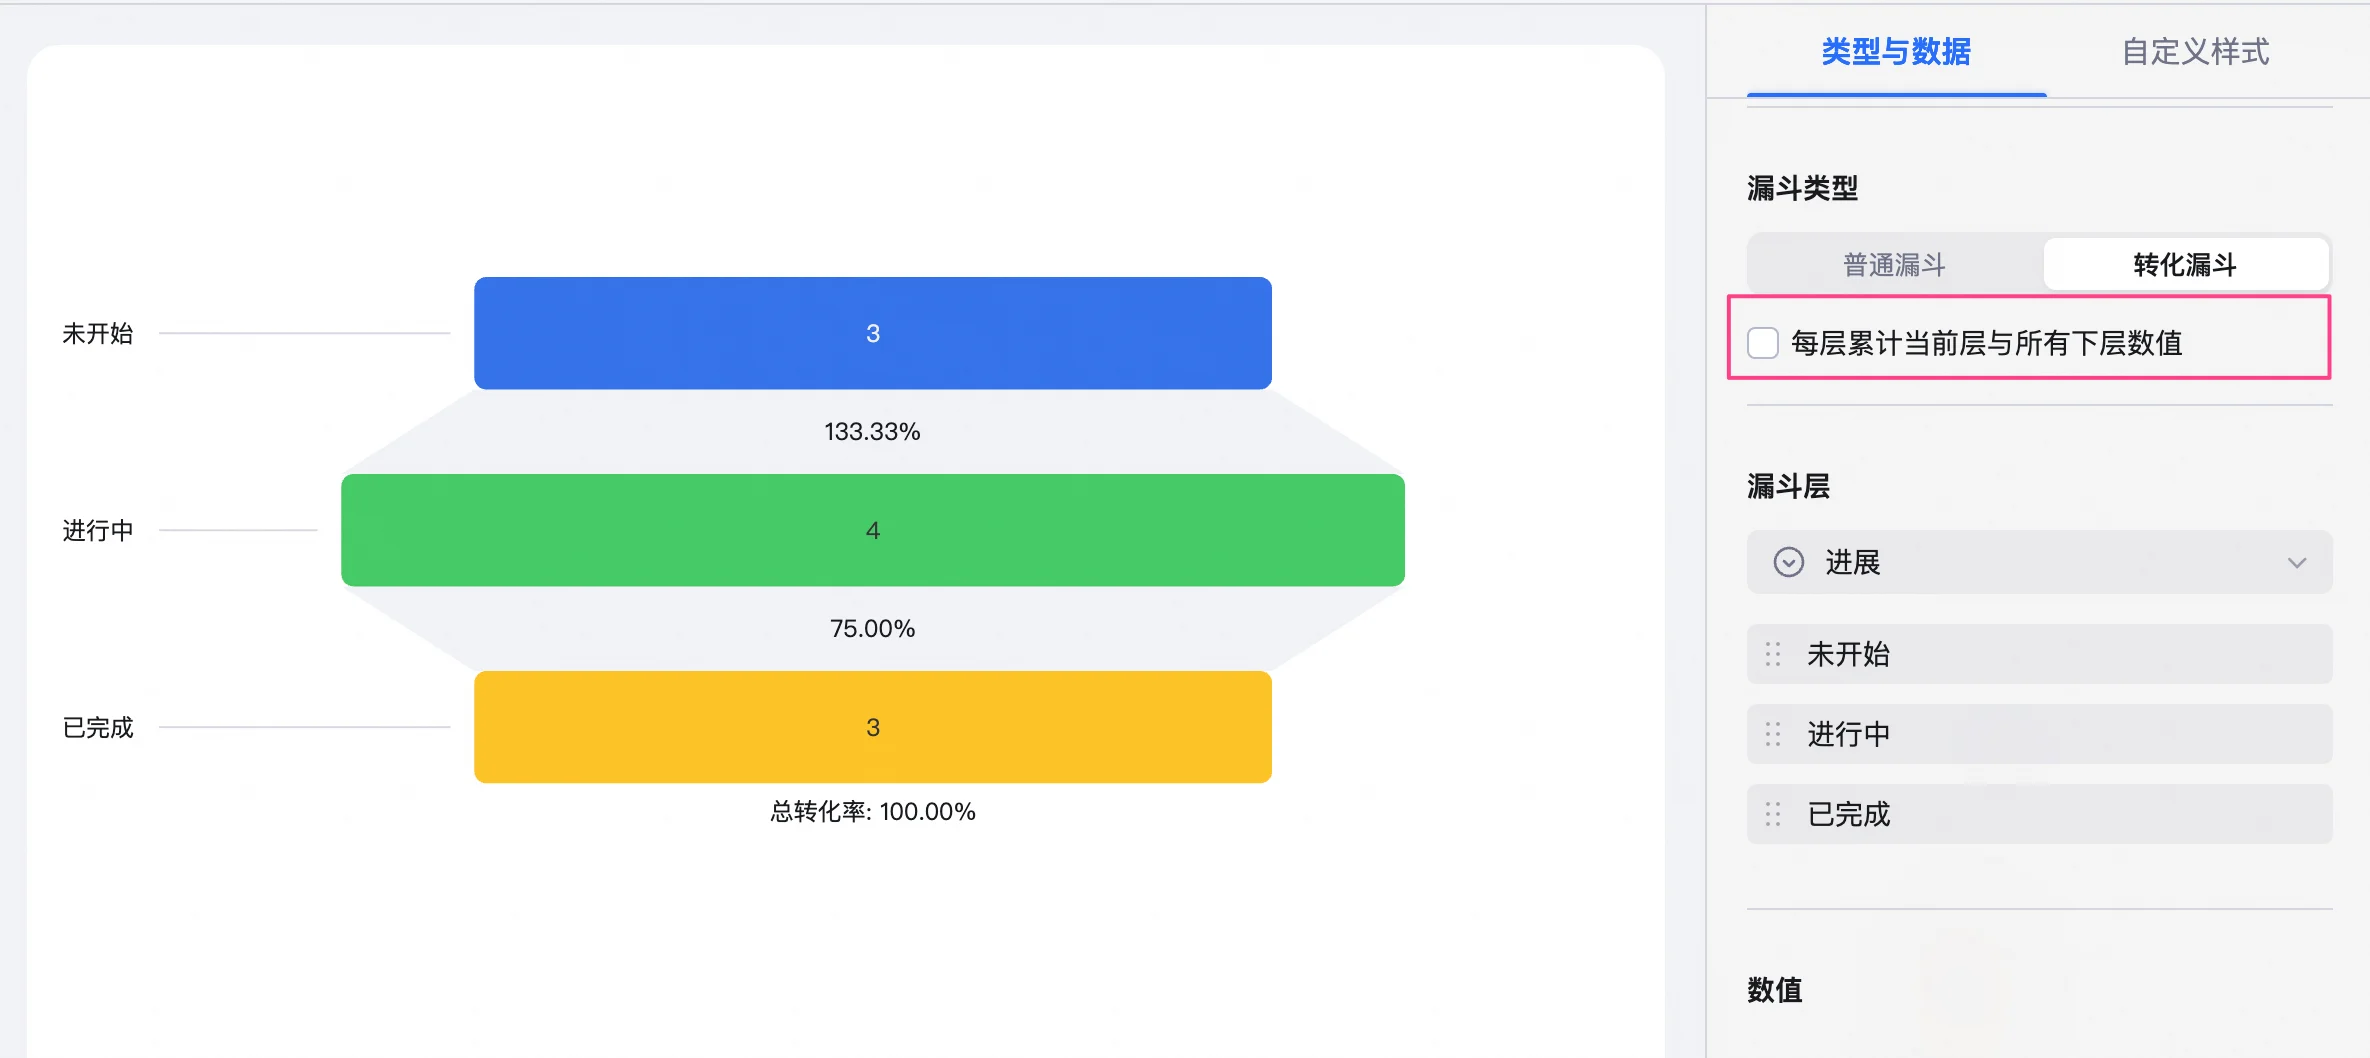
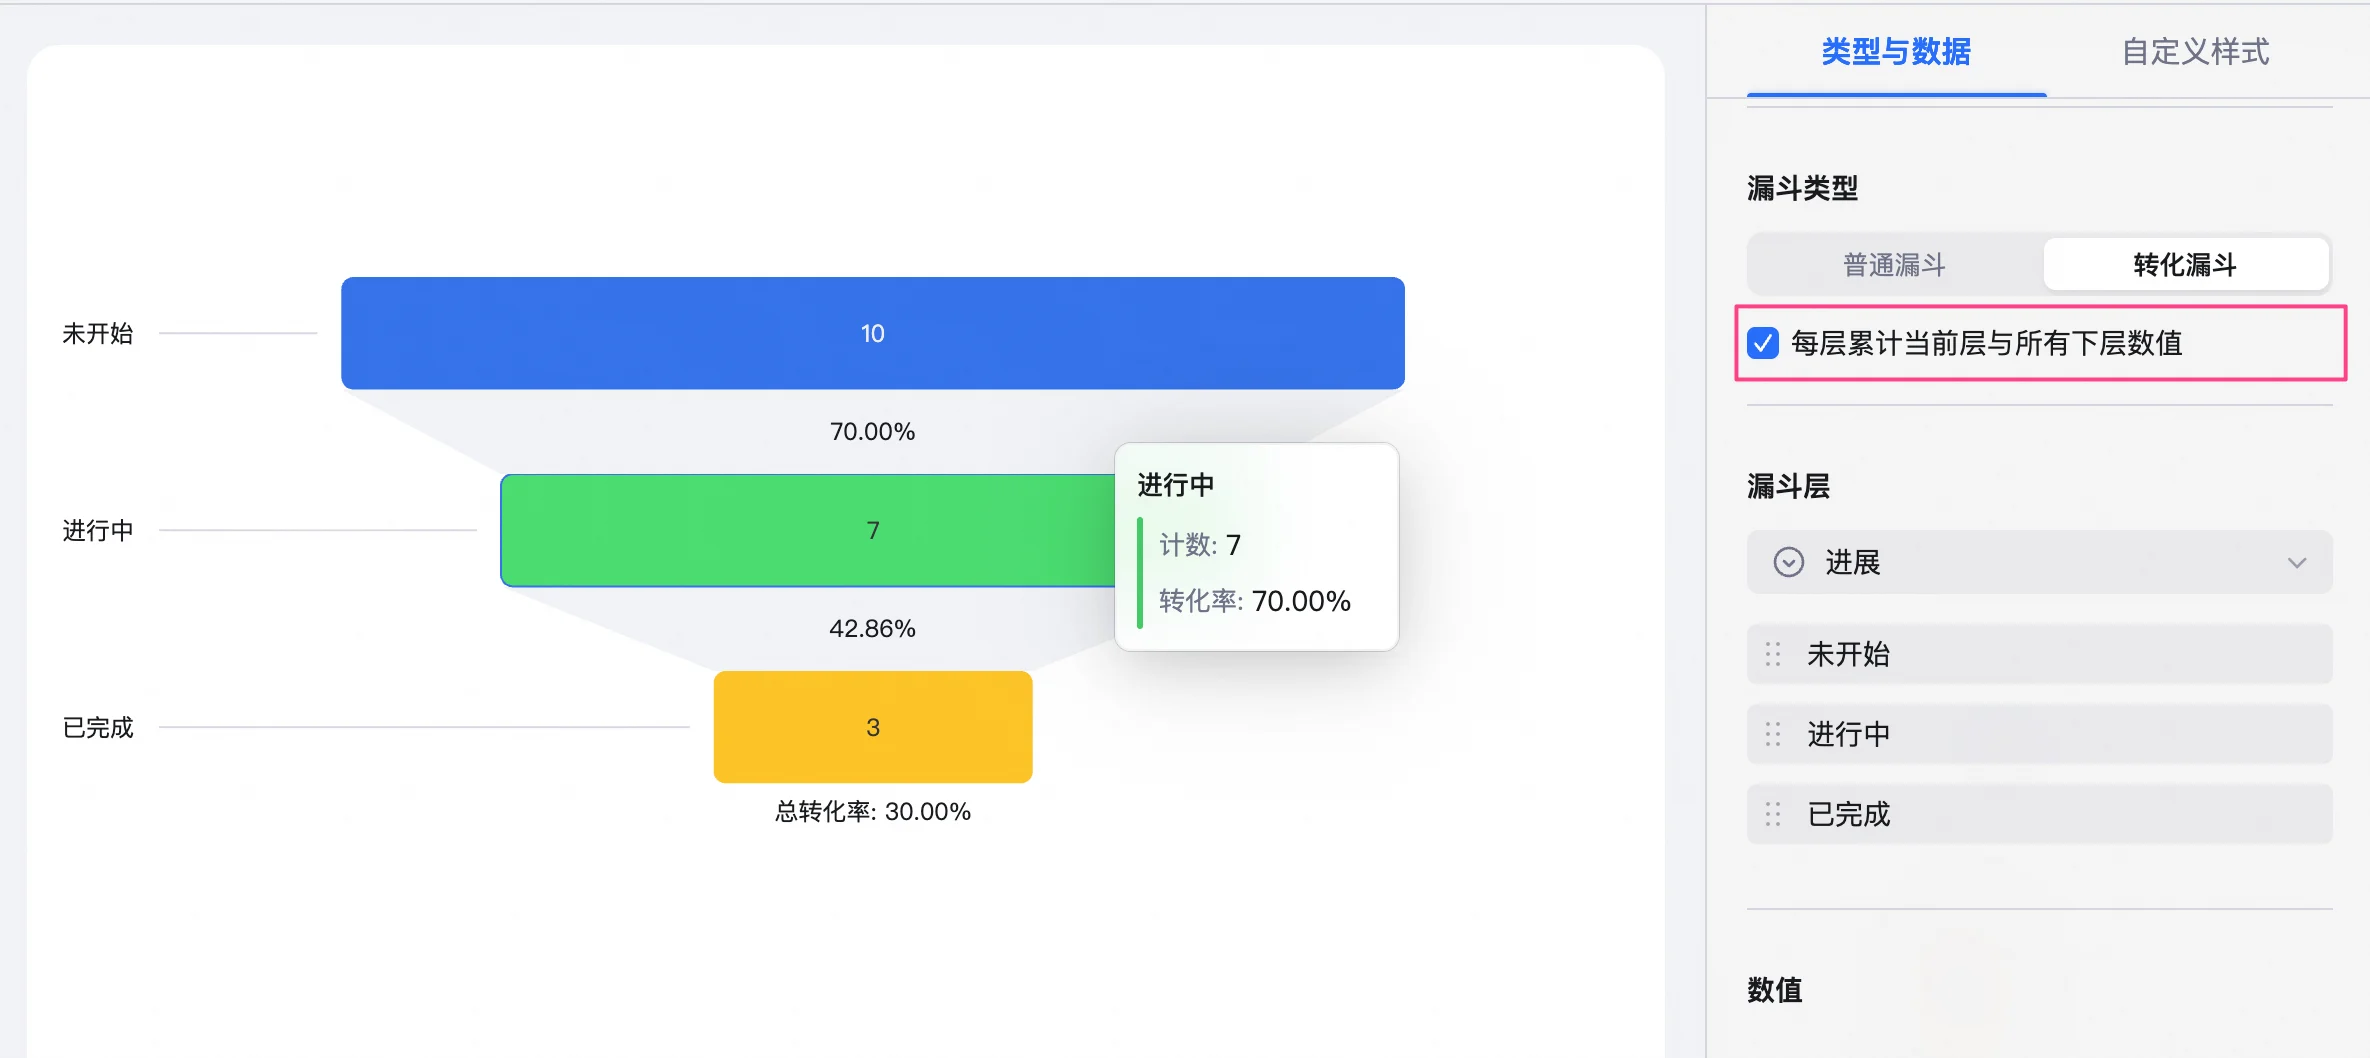
勾选是否**每层累计当前层与所有下层数值**。勾选此功能时，漏斗层的每一层都会统计该层及其下层的所有数据。当关闭此功能时，每层仅计算该层对应的数据。

<img src="https://mintcdn.com/dingtalk-8c0f98e2/zZ1woOCMPMuMJ7aq/zh/aitable/dashboards/dashboard-components/funnel-chart/images/image_qFDh7mBg1p.png?fit=max&auto=format&n=zZ1woOCMPMuMJ7aq&q=85&s=4c9ca7b4f517964df32f0c9dec4c4078" alt="" width="2370" height="1058" data-path="zh/aitable/dashboards/dashboard-components/funnel-chart/images/image_qFDh7mBg1p.png" />

<img src="https://mintcdn.com/dingtalk-8c0f98e2/zZ1woOCMPMuMJ7aq/zh/aitable/dashboards/dashboard-components/funnel-chart/images/image_iKTu2Q1F8V.png?fit=max&auto=format&n=zZ1woOCMPMuMJ7aq&q=85&s=5c5f744131f2fed8ee9bb3e837ee8211" alt="" width="2370" height="1058" data-path="zh/aitable/dashboards/dashboard-components/funnel-chart/images/image_iKTu2Q1F8V.png" />

**漏斗层：** 漏斗图中展示的不同层级。在多维表仪表盘中，漏斗图会根据选定字段的值生成对应的漏斗层，并显示该字段的值及其对应的数据。

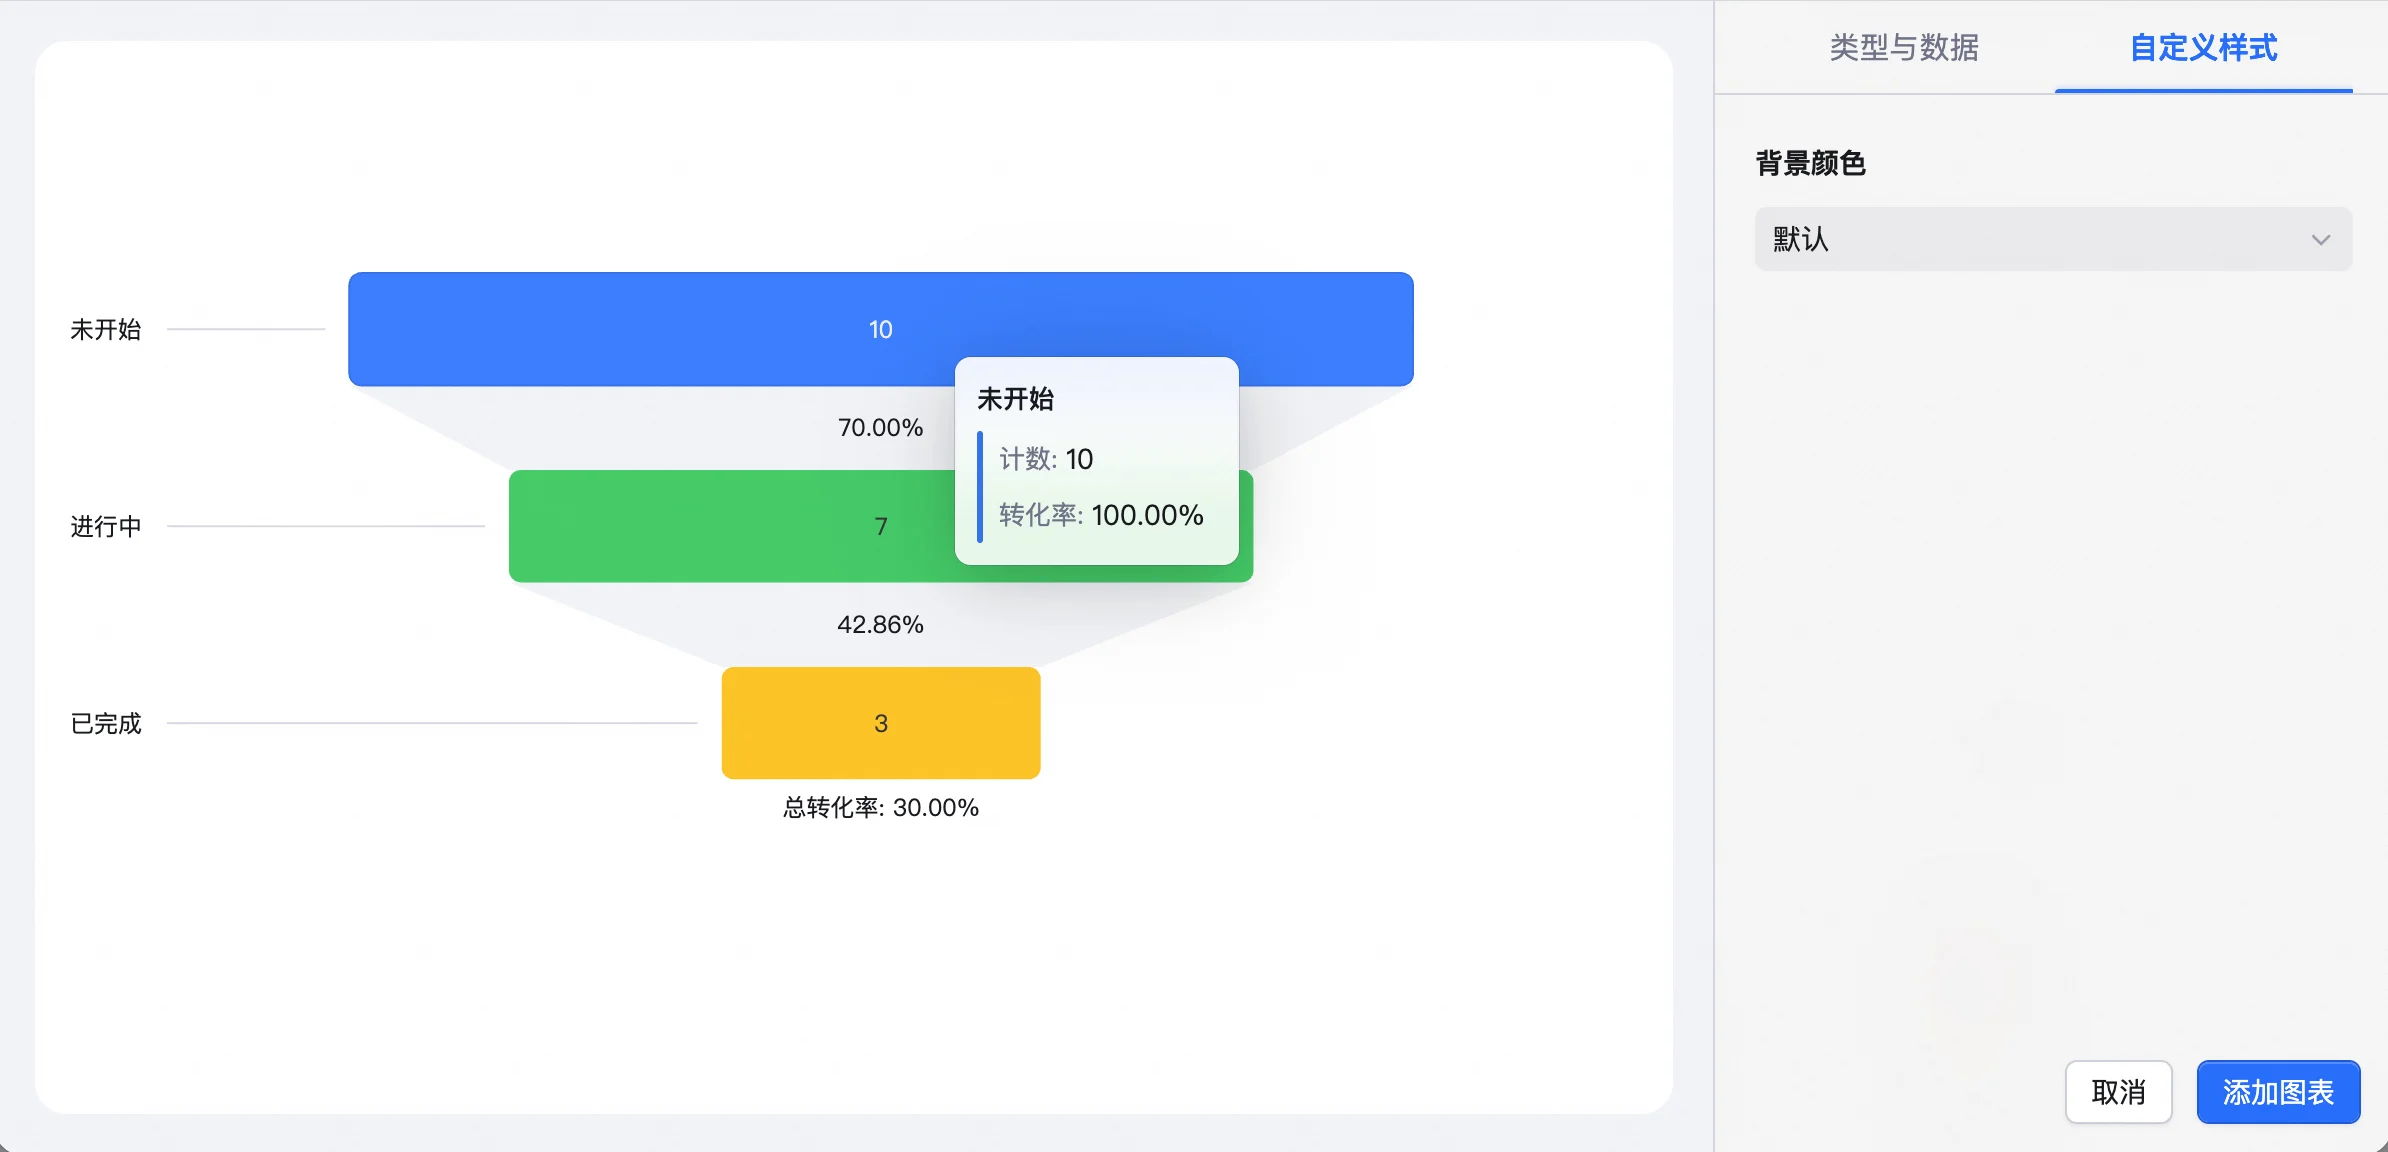
**自定义样式**：支持调整背景颜色。

## 查看漏斗图数据

对仪表盘有阅读权限的用户可在仪表盘上浏览漏斗图的数据。将光标悬停在漏斗层上时，显示该层的计数或数值，以及转化率。

<img src="https://mintcdn.com/dingtalk-8c0f98e2/YwlxKh9vB2sYUnZ_/zh/aitable/dashboards/dashboard-components/funnel-chart/images/image_PTwXt55GeJ.png?fit=max&auto=format&n=YwlxKh9vB2sYUnZ_&q=85&s=01bd3649cae7e04c8822577aec426010" alt="" width="2388" height="1152" data-path="zh/aitable/dashboards/dashboard-components/funnel-chart/images/image_PTwXt55GeJ.png" />

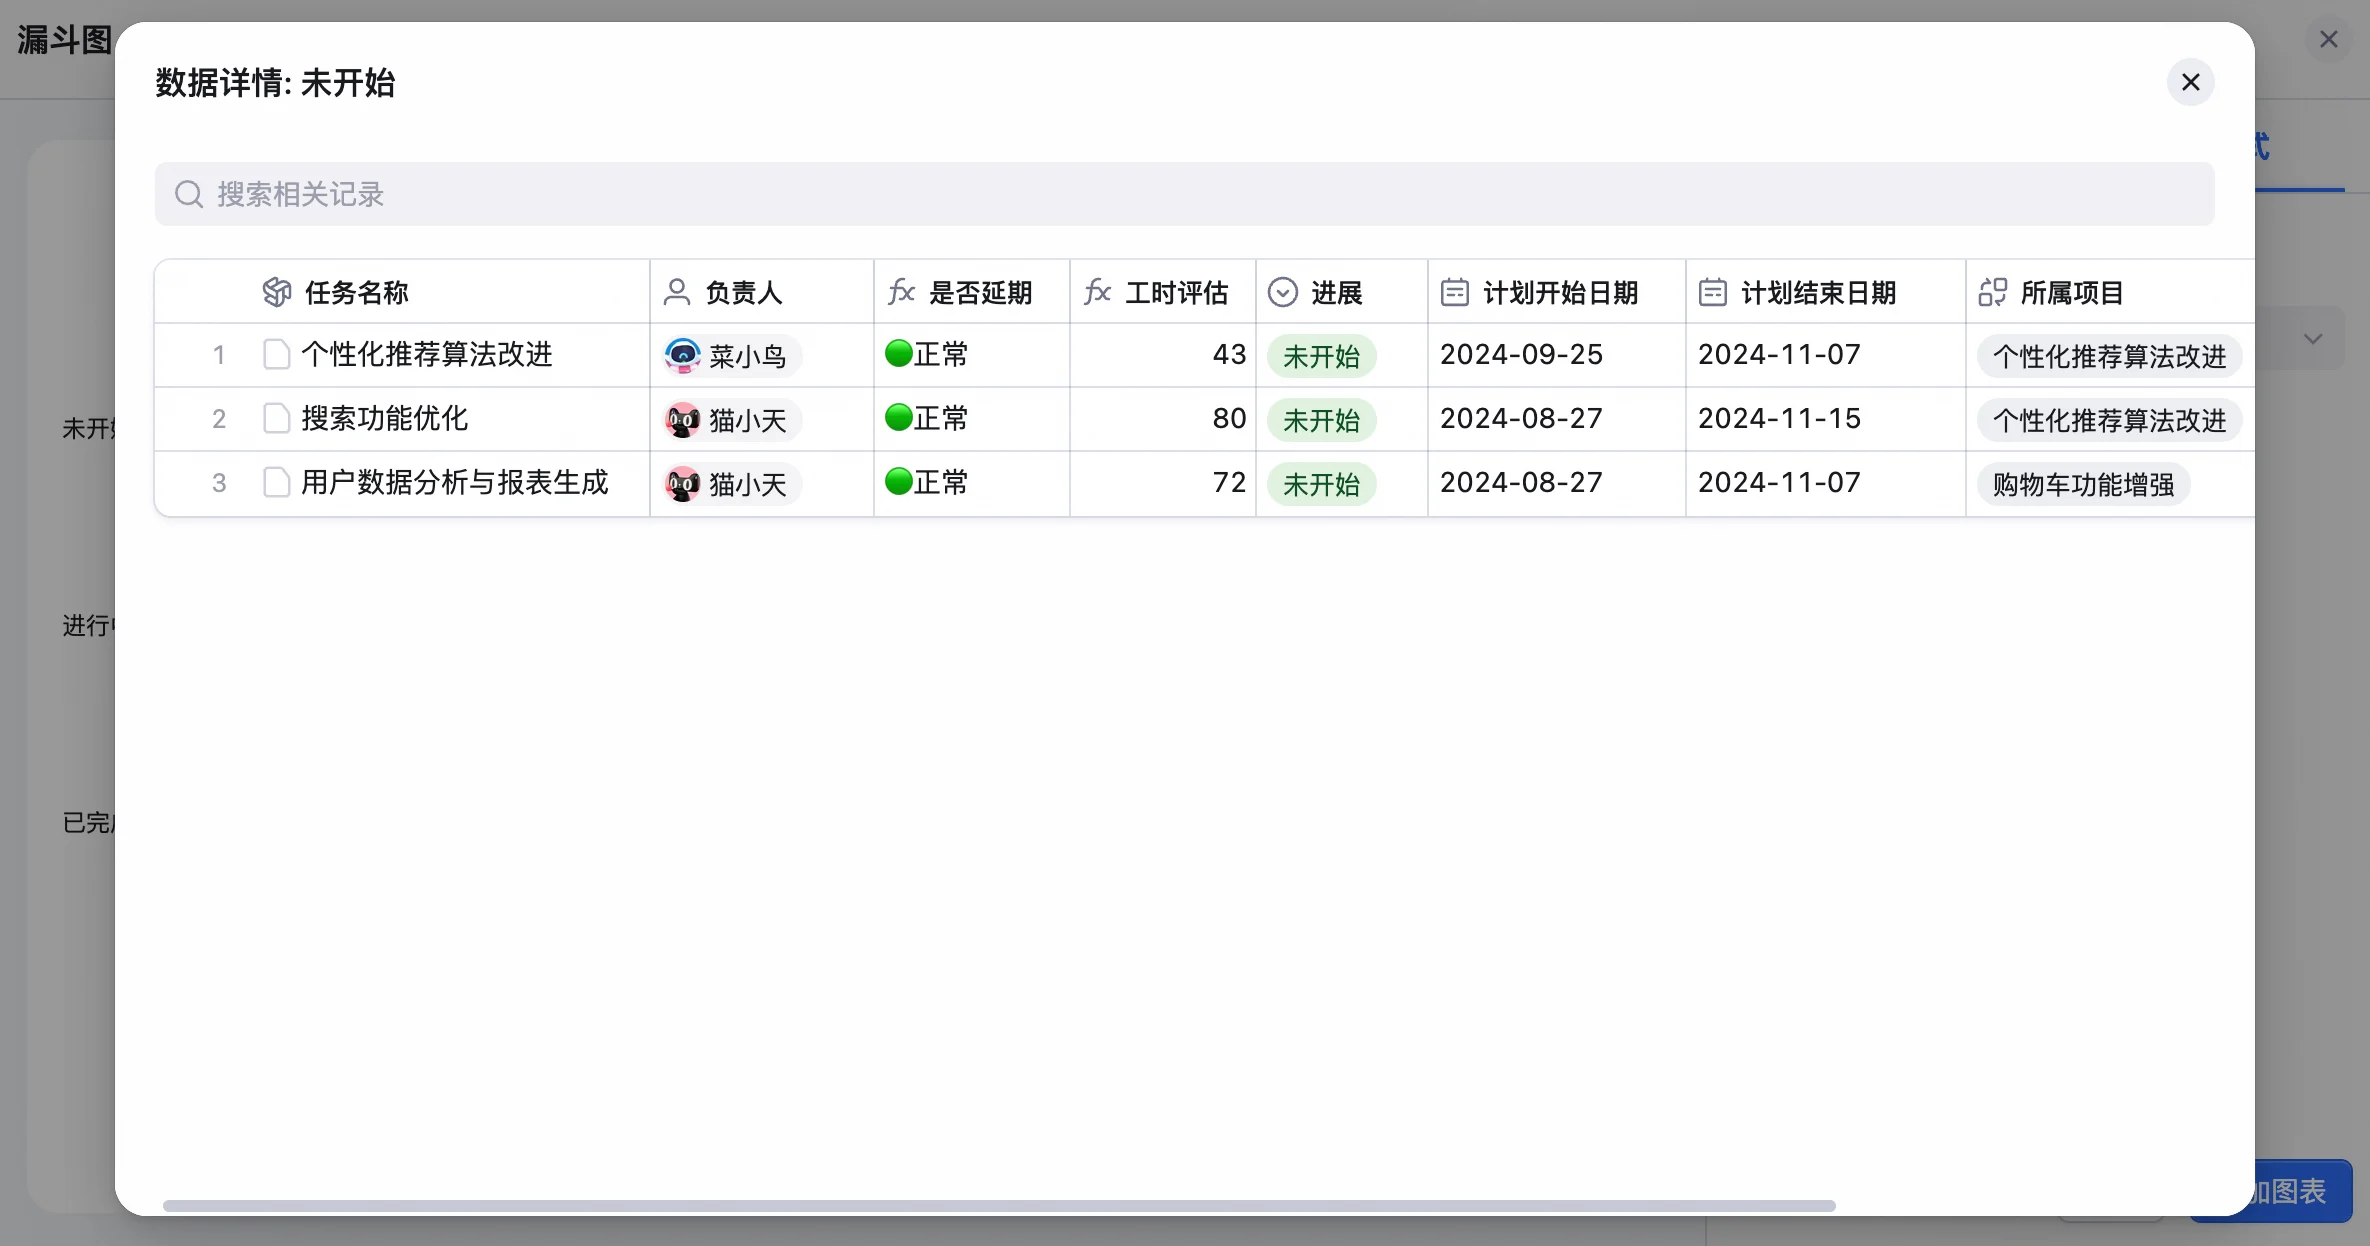
点击漏斗层，可在**数据详情**弹窗中查看该分类的详细数据。

<img src="https://mintcdn.com/dingtalk-8c0f98e2/YwlxKh9vB2sYUnZ_/zh/aitable/dashboards/dashboard-components/funnel-chart/images/image_bsPIPj8qfQ.png?fit=max&auto=format&n=YwlxKh9vB2sYUnZ_&q=85&s=5ebb073e79c485a73f610d276f7a98b0" alt="" width="2370" height="1246" data-path="zh/aitable/dashboards/dashboard-components/funnel-chart/images/image_bsPIPj8qfQ.png" />

## 管理漏斗图

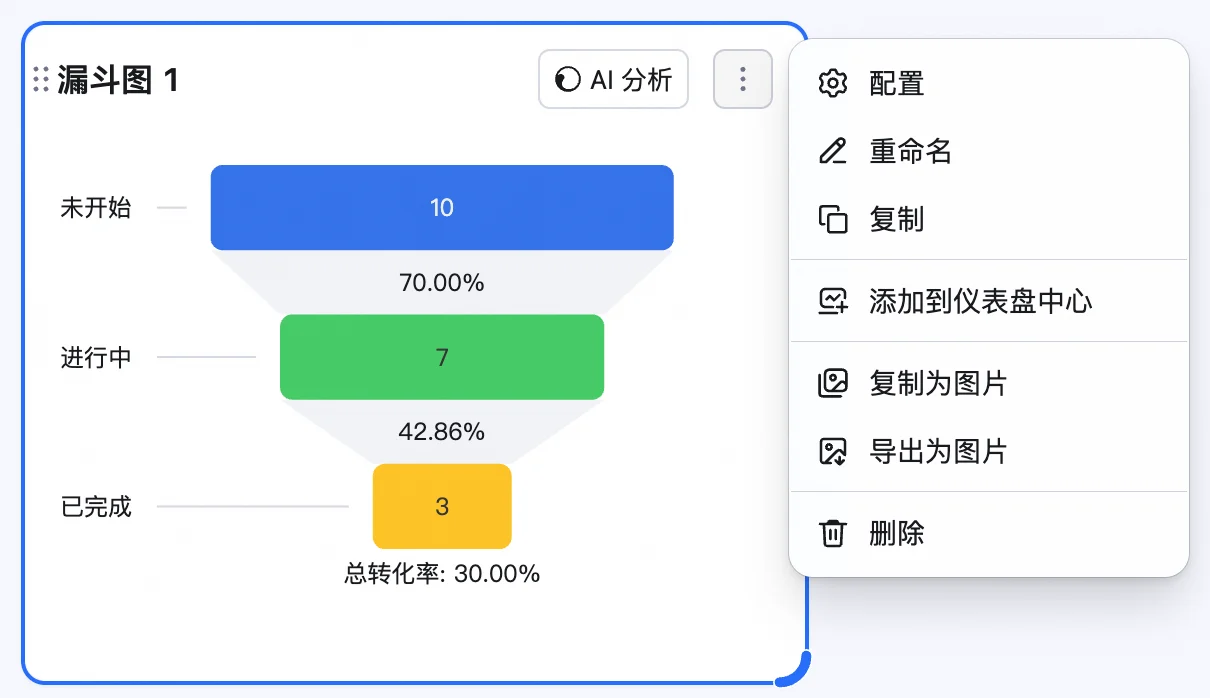
鼠标浮动至已添加的漏斗图上，在右上方找到    图标，点击后可以选择执行以下操作：配置、重命名、复制、添加到仪表盘中心、复制为图片、导出为图片和删除。

<img src="https://mintcdn.com/dingtalk-8c0f98e2/YwlxKh9vB2sYUnZ_/zh/aitable/dashboards/dashboard-components/funnel-chart/images/image_W_04FYSmJY.png?fit=max&auto=format&n=YwlxKh9vB2sYUnZ_&q=85&s=c6bc61d8c9e2d203d61be8f6b91de564" alt="" width="1210" height="698" data-path="zh/aitable/dashboards/dashboard-components/funnel-chart/images/image_W_04FYSmJY.png" />

此外，可以拖拽图表右下角来调整组件大小，或者拖拽组件上方区域来调整其位置。