

 Chats
Chats Calendar
 Meetings
 Contacts
 Mail
Mail Docs
Docs Drive
Drive AI Table
 AI Minutes
 Attendance
 Approval
 YiDA
YiDA Admin Console
View Organization Performance Data
To view organization performance data, follow these steps.1
Step 1
Sign in to the YiDA workbench.
2
Step 2
Click the (Platform management) button  in the upper-right corner, and then click Organization performance.
in the upper-right corner, and then click Organization performance.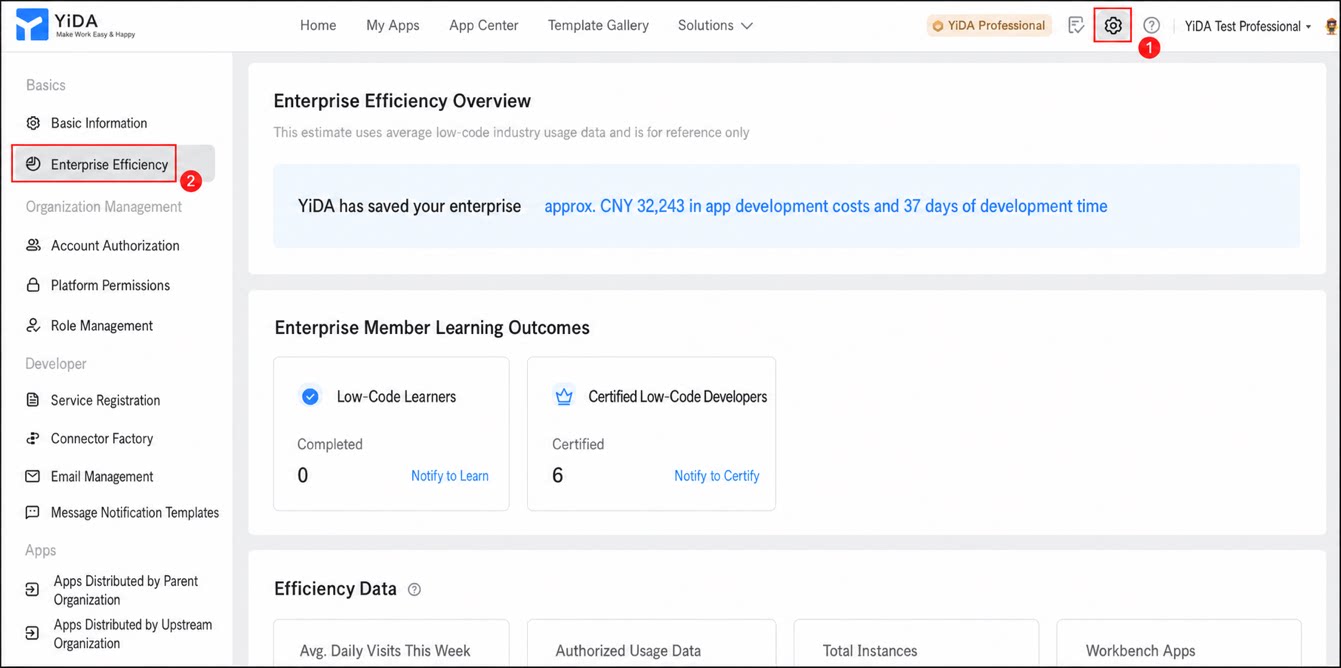
Performance Data Overview
The organization performance overview shows the total app development budget and development time that YiDA has saved for your organization. This data is calculated based on the average usage across the low-code industry and is for reference only.User Learning Outcomes
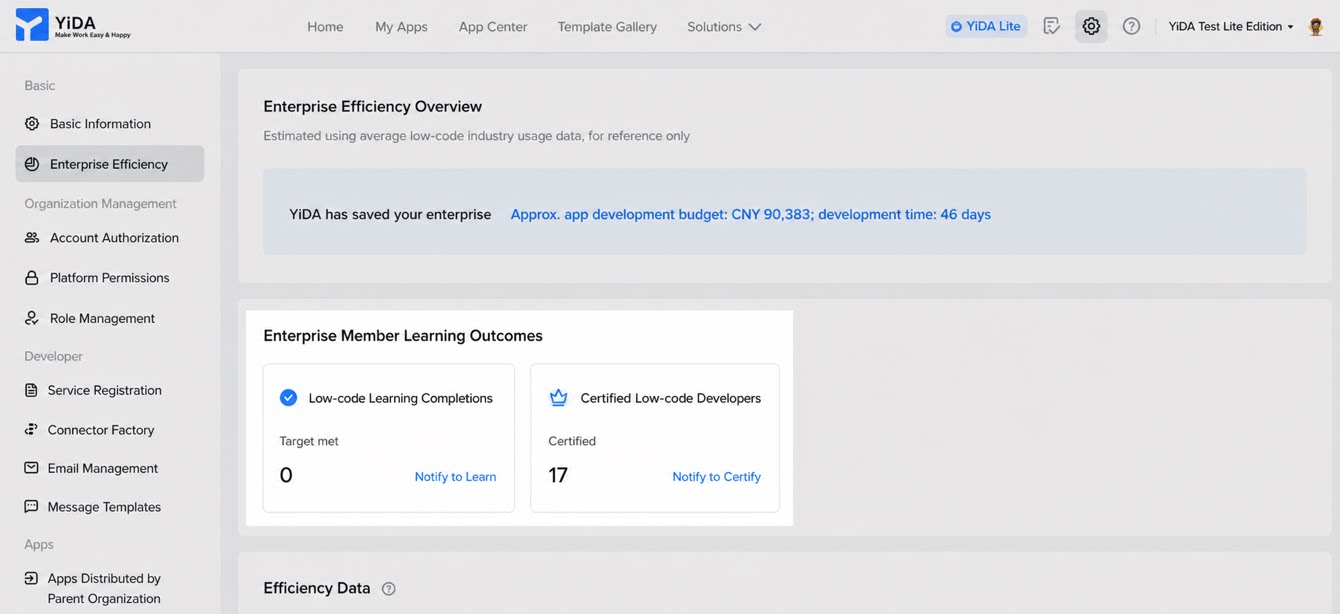
In this section, you can view the number of users in your organization who have completed low-code training, along with the number of certified low-code developers. You can also click to notify users to complete training and certification.- Only data from before 24:00 the previous day is shown. Users who complete training and certification on the current day are counted starting the next day.
- The number of certified low-code developers includes all users in your organization who hold a basic, intermediate, or advanced certification.
- Certifications are tied to individual users in your organization. If a user has completed certification but is not reflected in the data, click the Smart Service Assistant in the lower-right corner of the page for help.
Performance Data
In the performance data section, you can review your organization’s usage of YiDA, including the weekly daily-average UV, number of apps, number of workbench apps, number of custom-built apps, number of template apps, number of app creators, and cumulative form instances.- Performance data reflects the level of digitalization your organization has achieved with low-code products.
- Some latency in the statistics for each performance metric is normal.
- The industry reference value refers to the corresponding metric for organizations of a similar workforce size, and is for reference only.
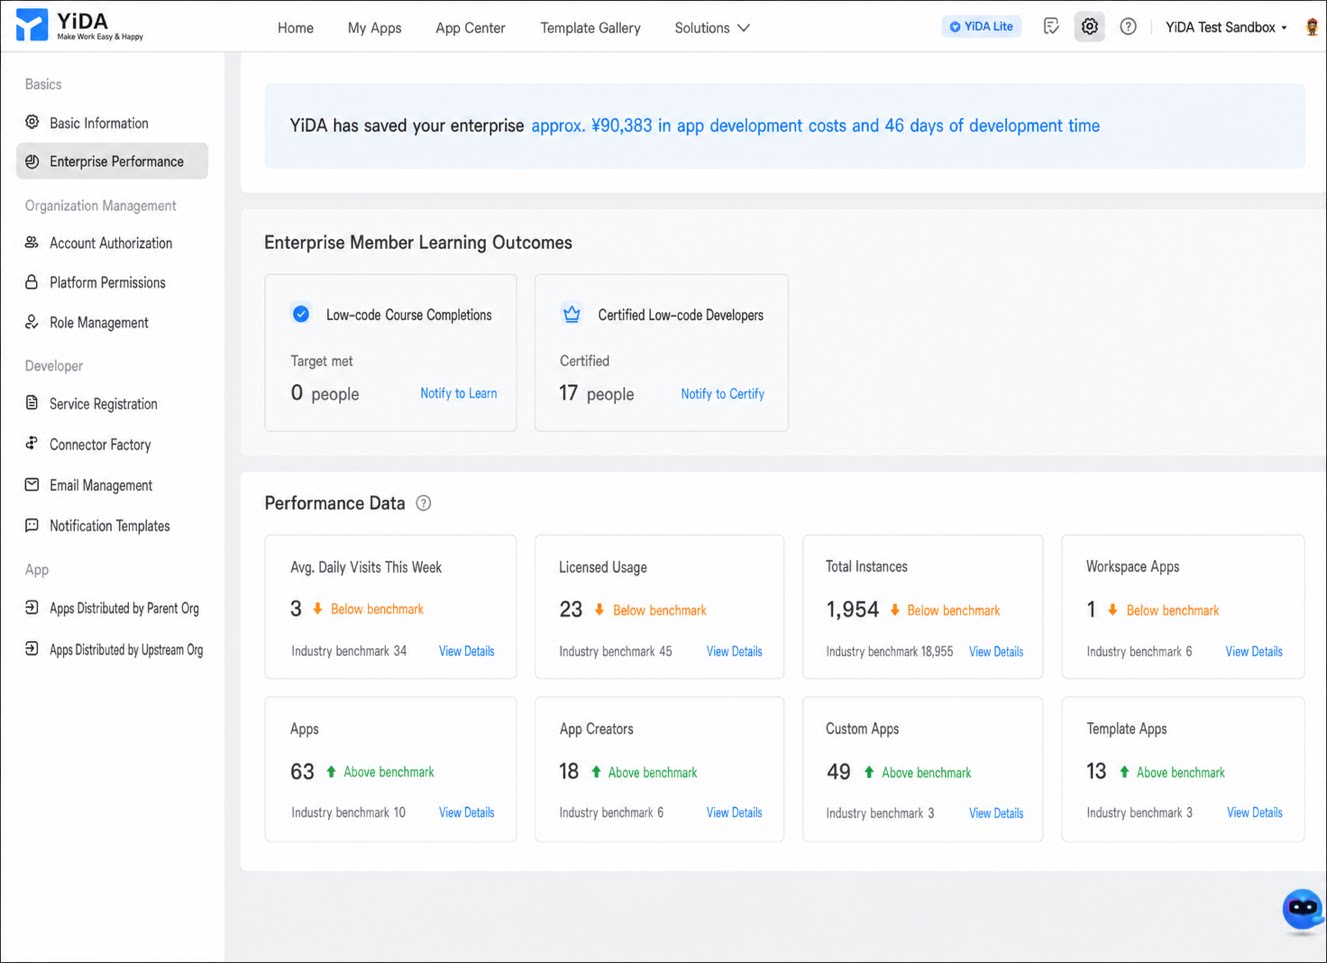
YiDA Dedicated edition also supports viewing details for each performance metric. For more information, see YiDA Dedicated.