What is AI Table?
AI Table is a next-generation collaborative database built on a spreadsheet-like interface. You can link tables together and view the same data in multiple formats — grid, gantt, calendar, kanban, gallery, and more — each one tailored to a different scenario, so teams can present, discuss, and update information without leaving the table. Unlike a traditional spreadsheet, every column in AI Table is a typed field and every row is a record. By sorting, filtering, and grouping your data, the same dataset can become a dashboard, a task tracker, an analysis workspace, or a status report — all powered by a single source of truth. AI Table is designed to solve the everyday pain points teams hit with spreadsheets:Data management and visualization
Switch between views and assemble dashboards in minutes. Build charts and live dashboards without complex setup, and analyze trends across your data at a glance.Hard-to-control data security
Advanced Permissions give you fine-grained control over who can view or edit specific data, allowing you to protect and isolate information by row or column within a single table.Slow collaboration and communication
Member reminders, date reminders, multi-channel notifications, and AI Table automations can send updates, route tasks, and refresh records automatically — so your team responds faster and collaborates with less friction.Inconsistent data across tables
Link tables together so a change in one place flows everywhere. No manual syncing, no inconsistent copies across sources — your data stays consistent automatically.The AI Table interface
❶ Main navigation
Switch between the four primary modules: Data, Automation, App, and Form.❷ Tables
The left sidebar lists every table in the current AI Table (along with any dashboards you’ve created). A table is a sheet-like structure that stores your data.❸ Views
A view is a way of looking at the data. Within a single table you can create multiple views, each with its own style, filters, sorts, and grouping — perfect for analyzing the same dataset from different angles.❹ Records
A record is a row in AI Table. Each row you add becomes a record in the table.❺ Fields
A field is a column in AI Table. Fields are typed — text, number, date, attachment, and even an AI Agent field — and AI Table offers a rich set of field types to fit any data shape.Basic operations
Create an AI Table
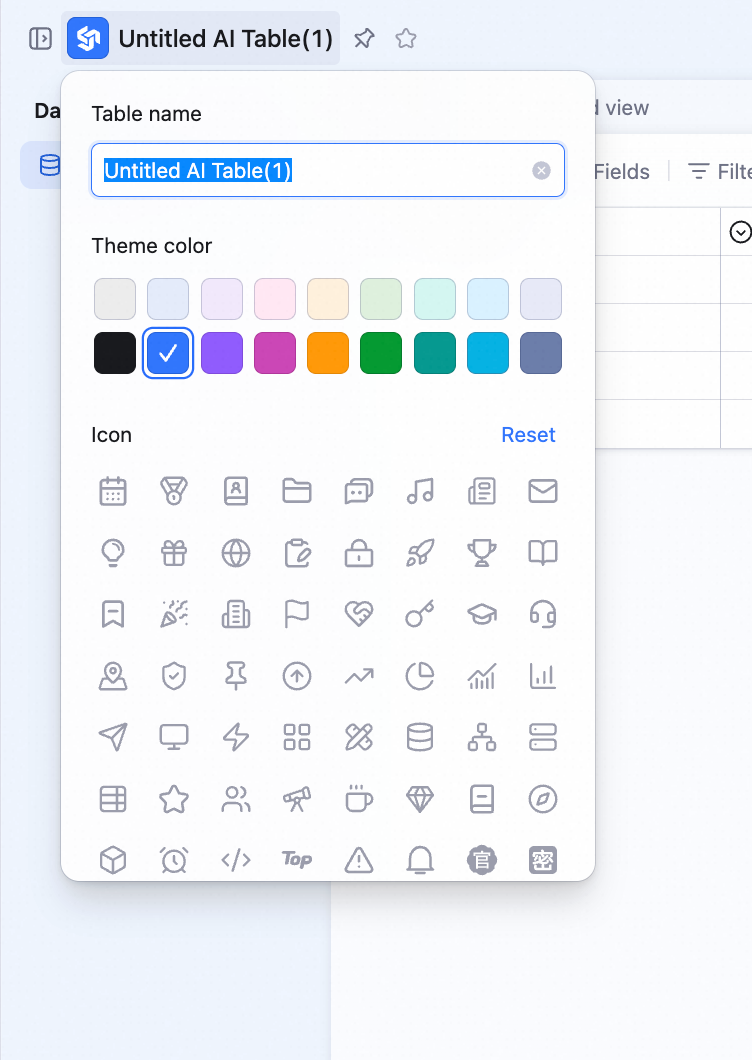
From the AI Table home page, you can create a new table in several ways: start blank, import an Excel or online spreadsheet, create a form, create a dashboard, or pick a template.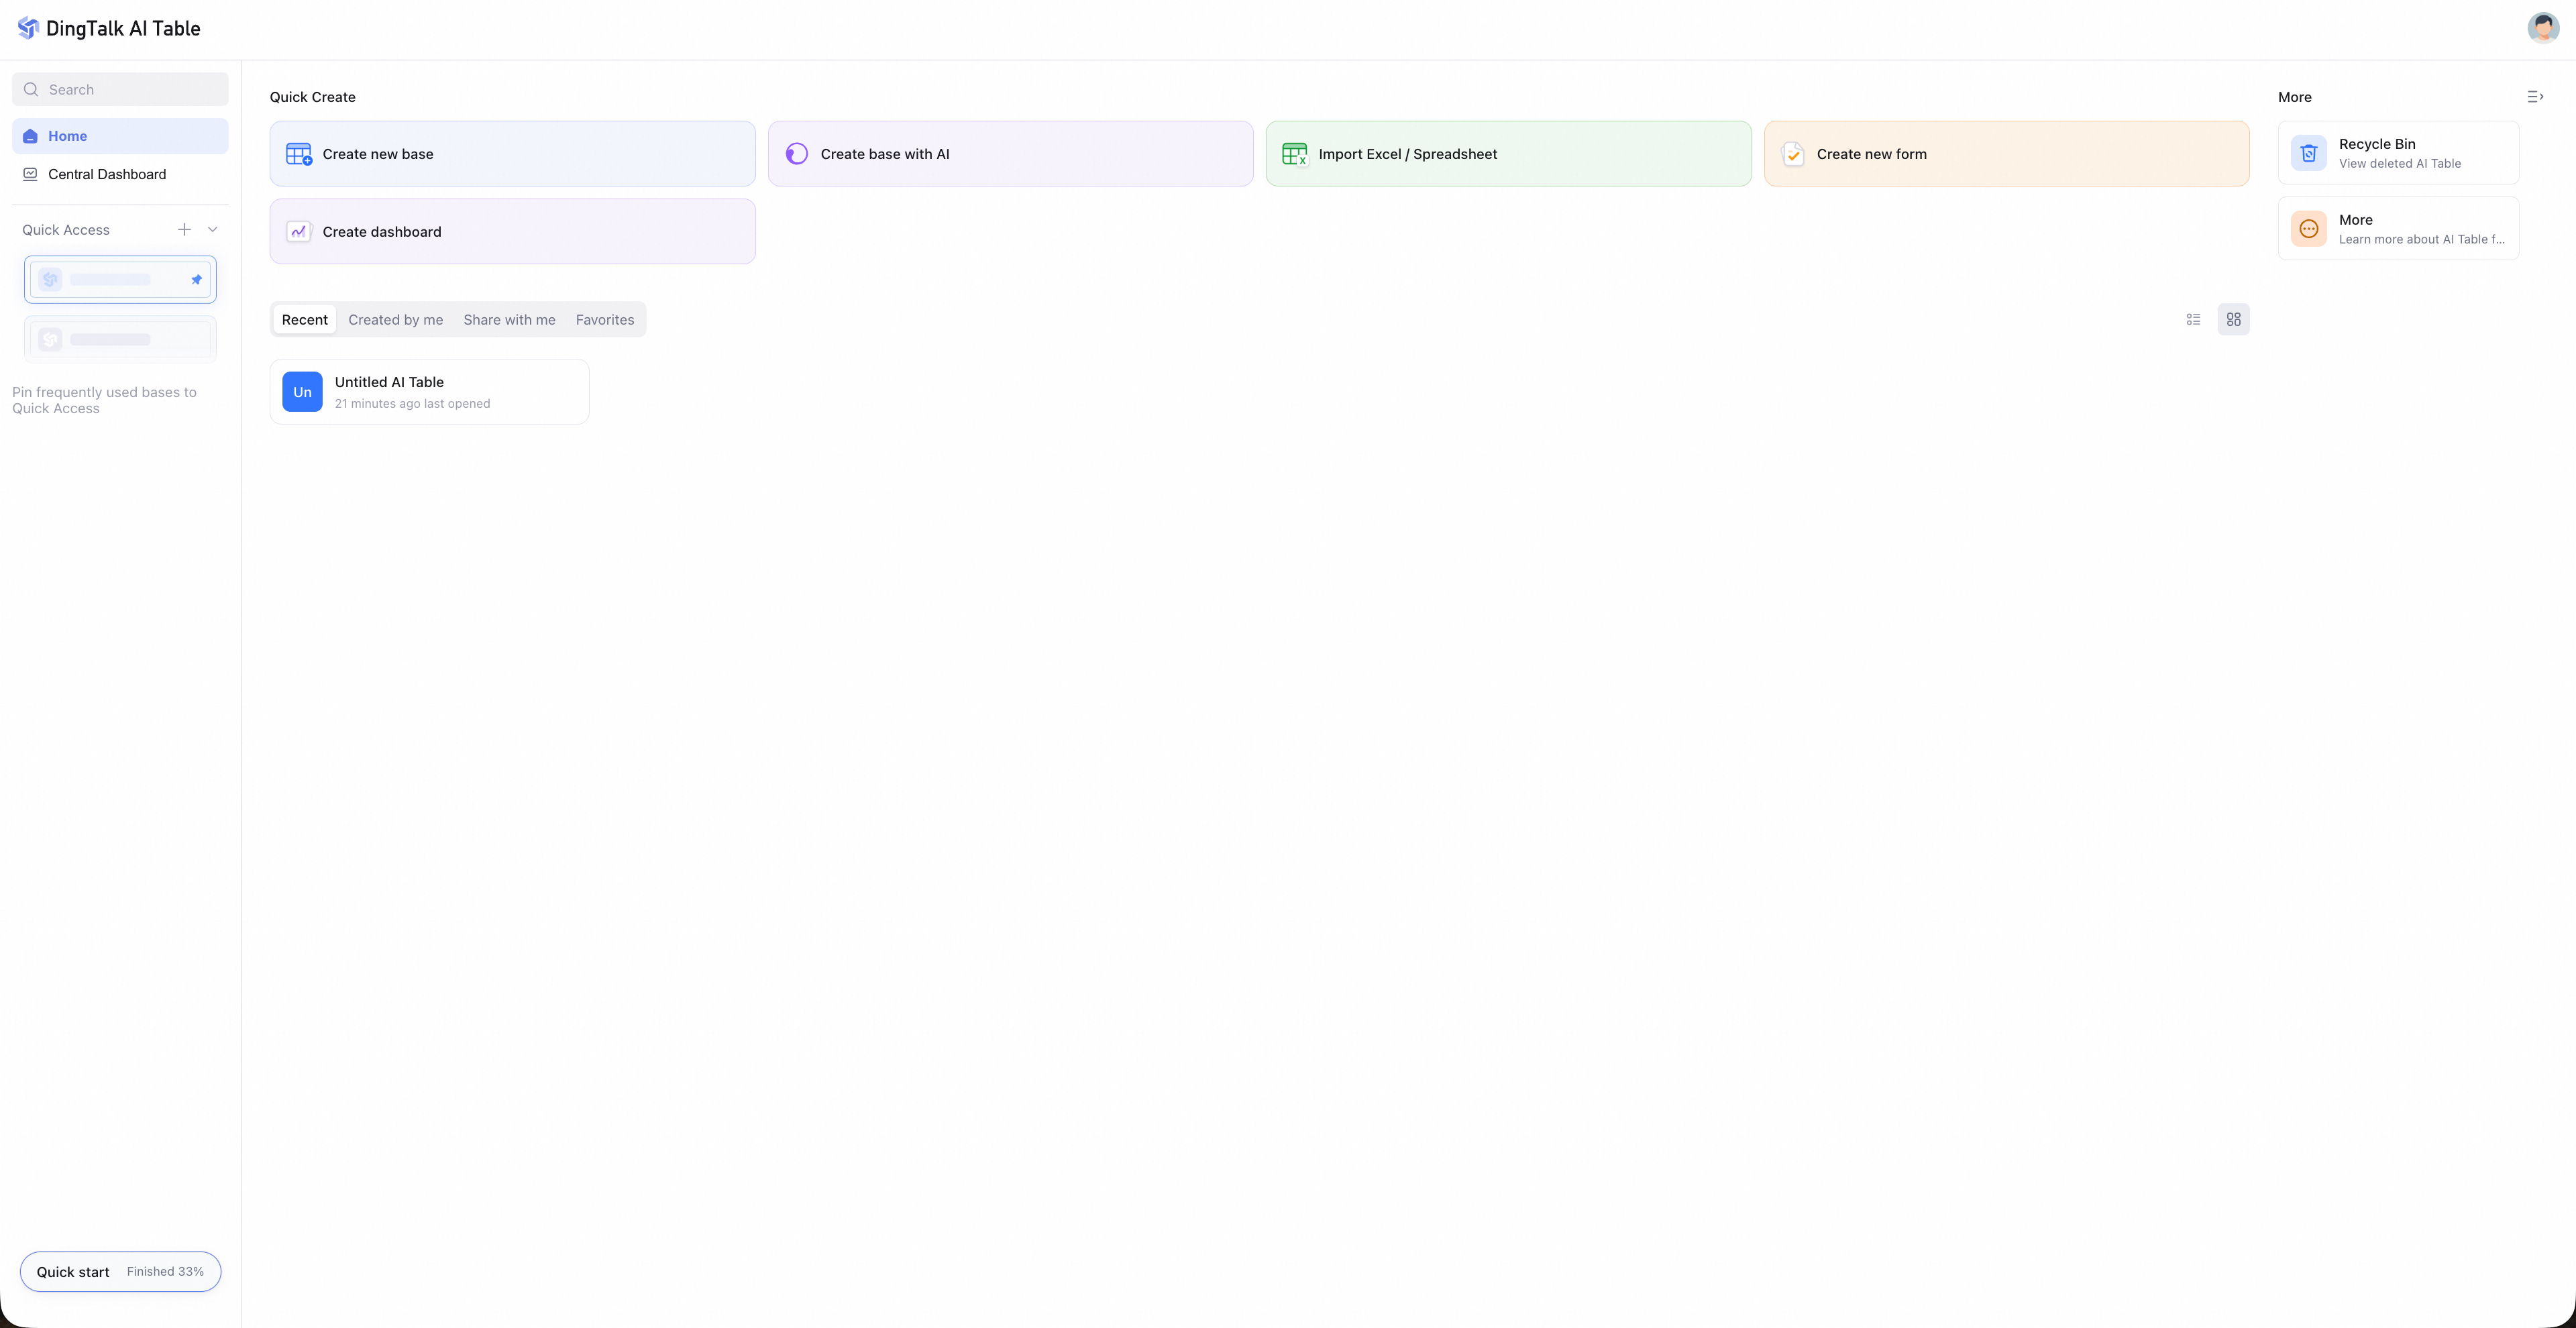 After creating an AI Table, click the title in the top-left corner to rename it, change its theme color, or add an icon.
Create a table
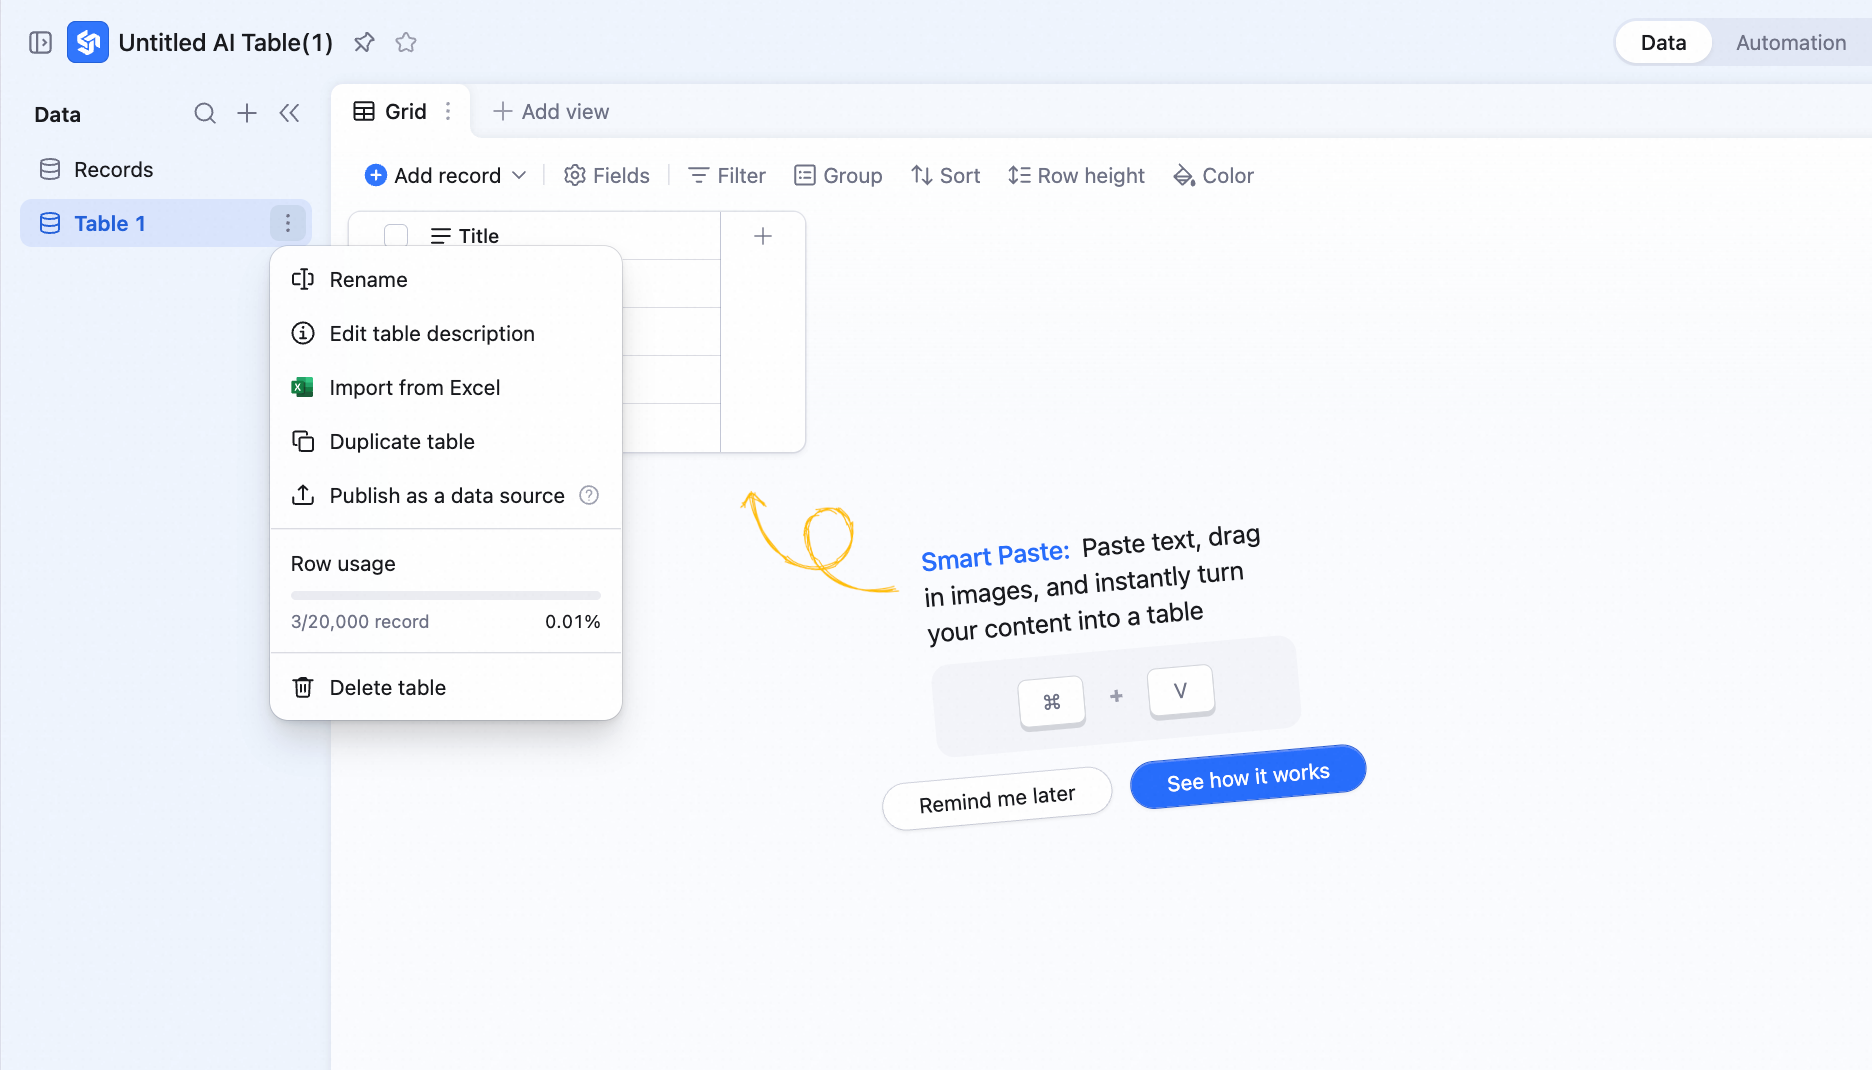
Click + in the bottom-left corner to create a new table. Click the menu icon to the right of any table to rename, edit the description, duplicate, move, or delete it.
Create a view
Click + New view to the right of the view tabs to add a new view. For details, see Working with views.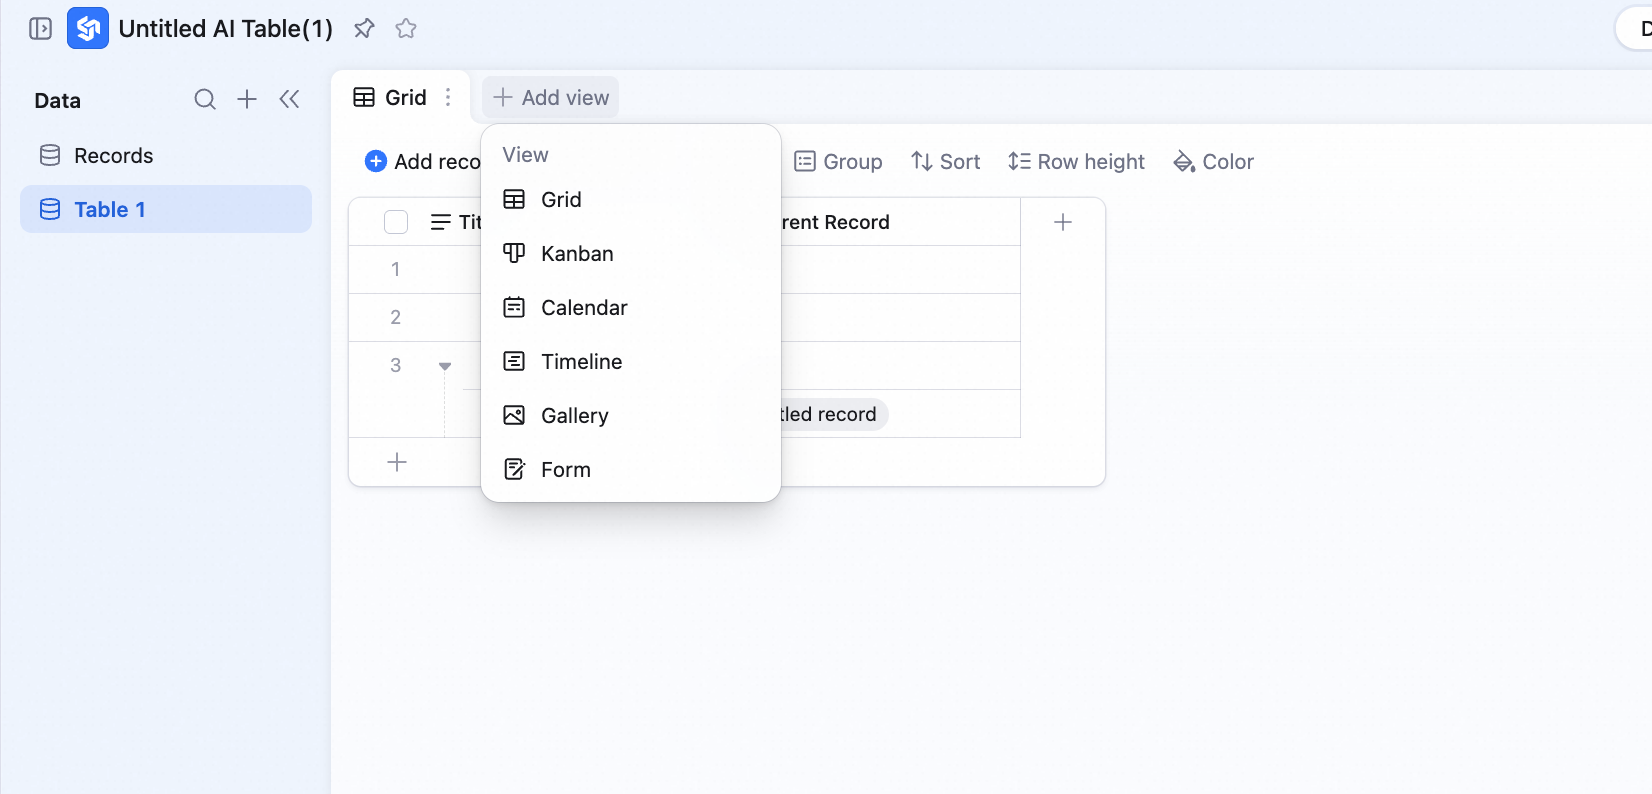
Create a field
Click the + icon to the right of the column headers to add a new field. For more, see Add a field.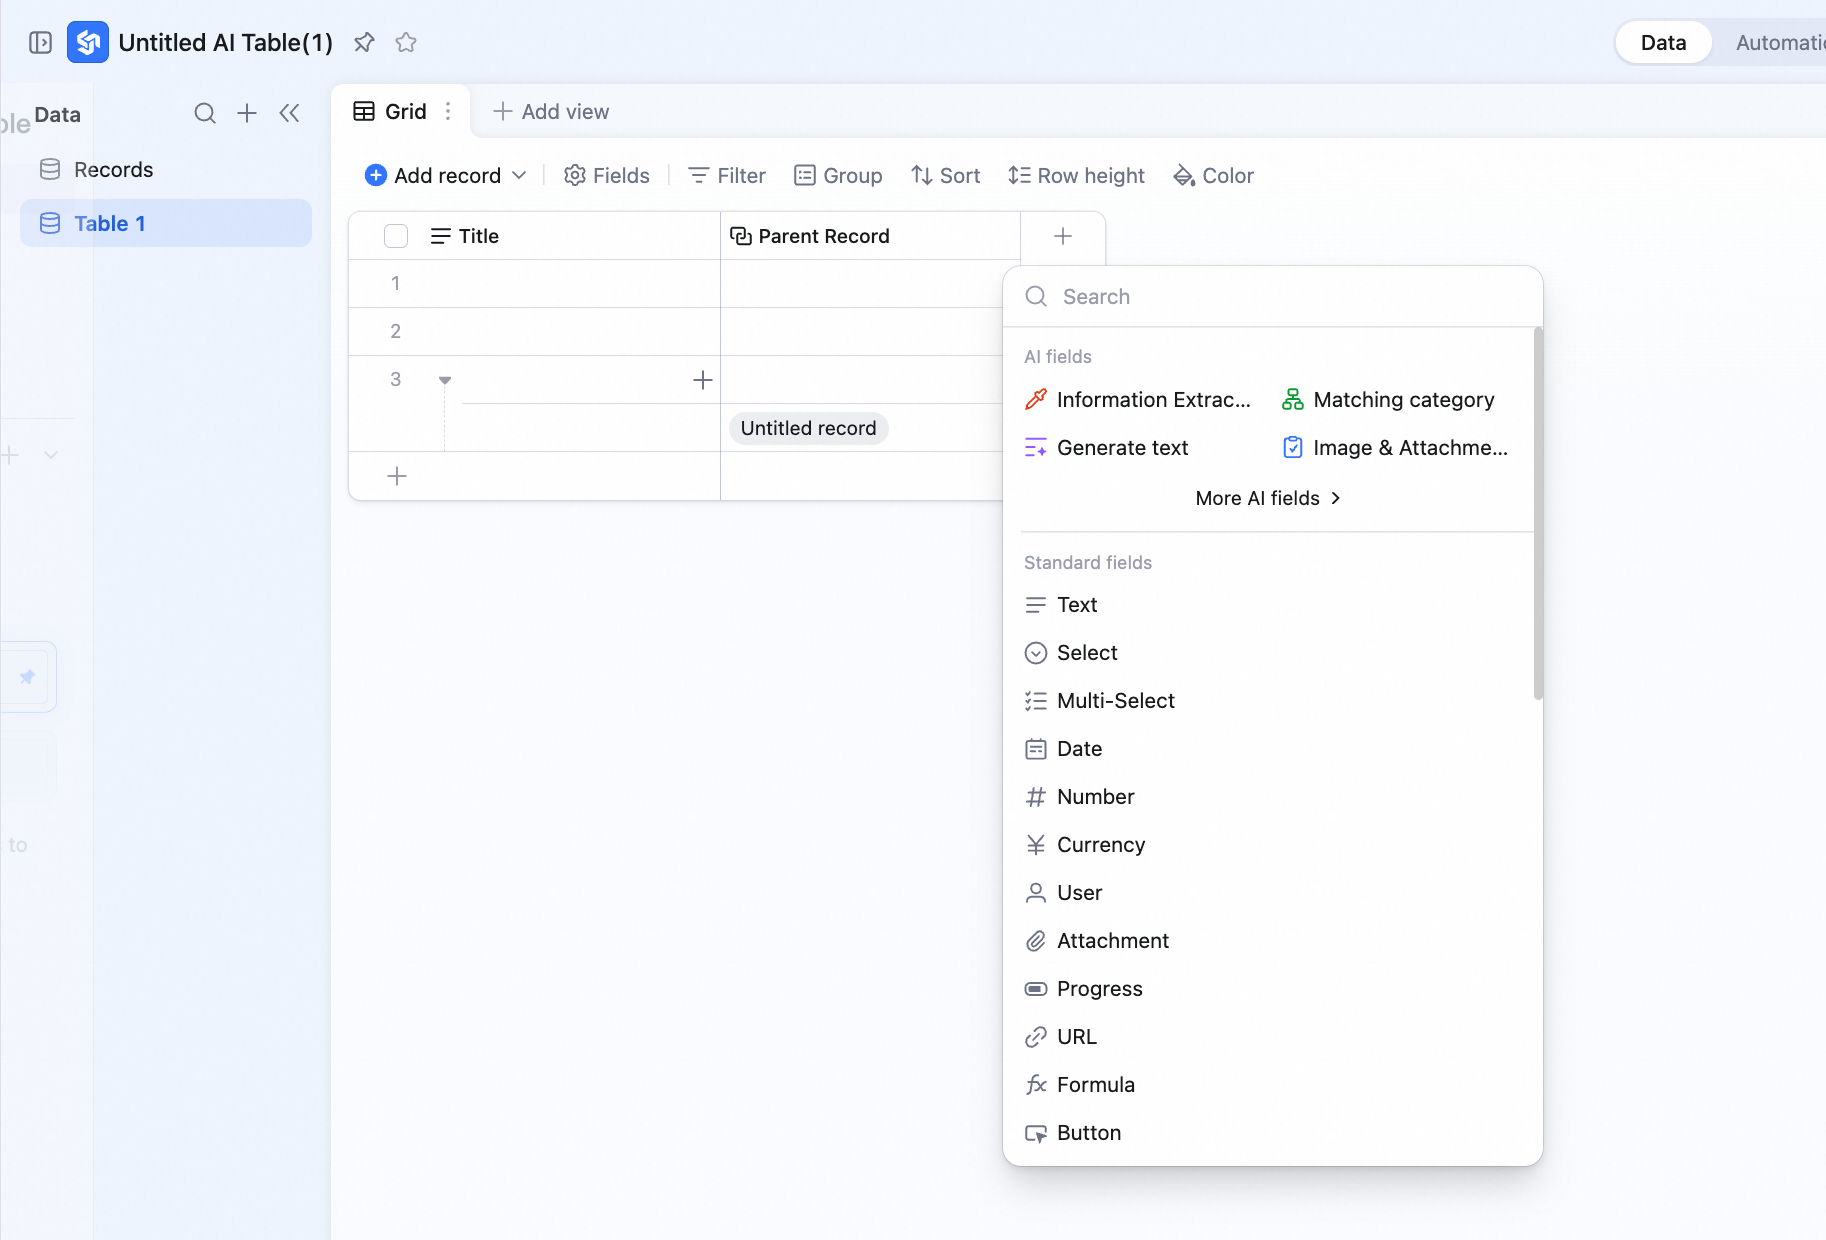
Create a folder
Folders help you organize the tables and dashboards in the left sidebar. Drag tables or dashboards into a folder to group them. Deleting a folder does not delete its contents. Note: folders can be nested up to two levels deep.Core capabilities
Group, filter, and sort with rich field types
Each column in AI Table is a field — the column header that defines the data type and display format for everything below it. Combine grouping, filters, and sorting to fit almost any data-editing or reporting scenario. For more on grouping and sorting, see Grouping.
Multiple views per table
Multiple views over a single dataset is the heart of AI Table. Depending on the shape of your data and how you want to use it, switch between grid, kanban, gantt, gallery, and other view types. For more, see Working with views.Automation workflows
AI Table automations let you build no-code workflows that dramatically speed up day-to-day work. For more, see Working with automation workflows.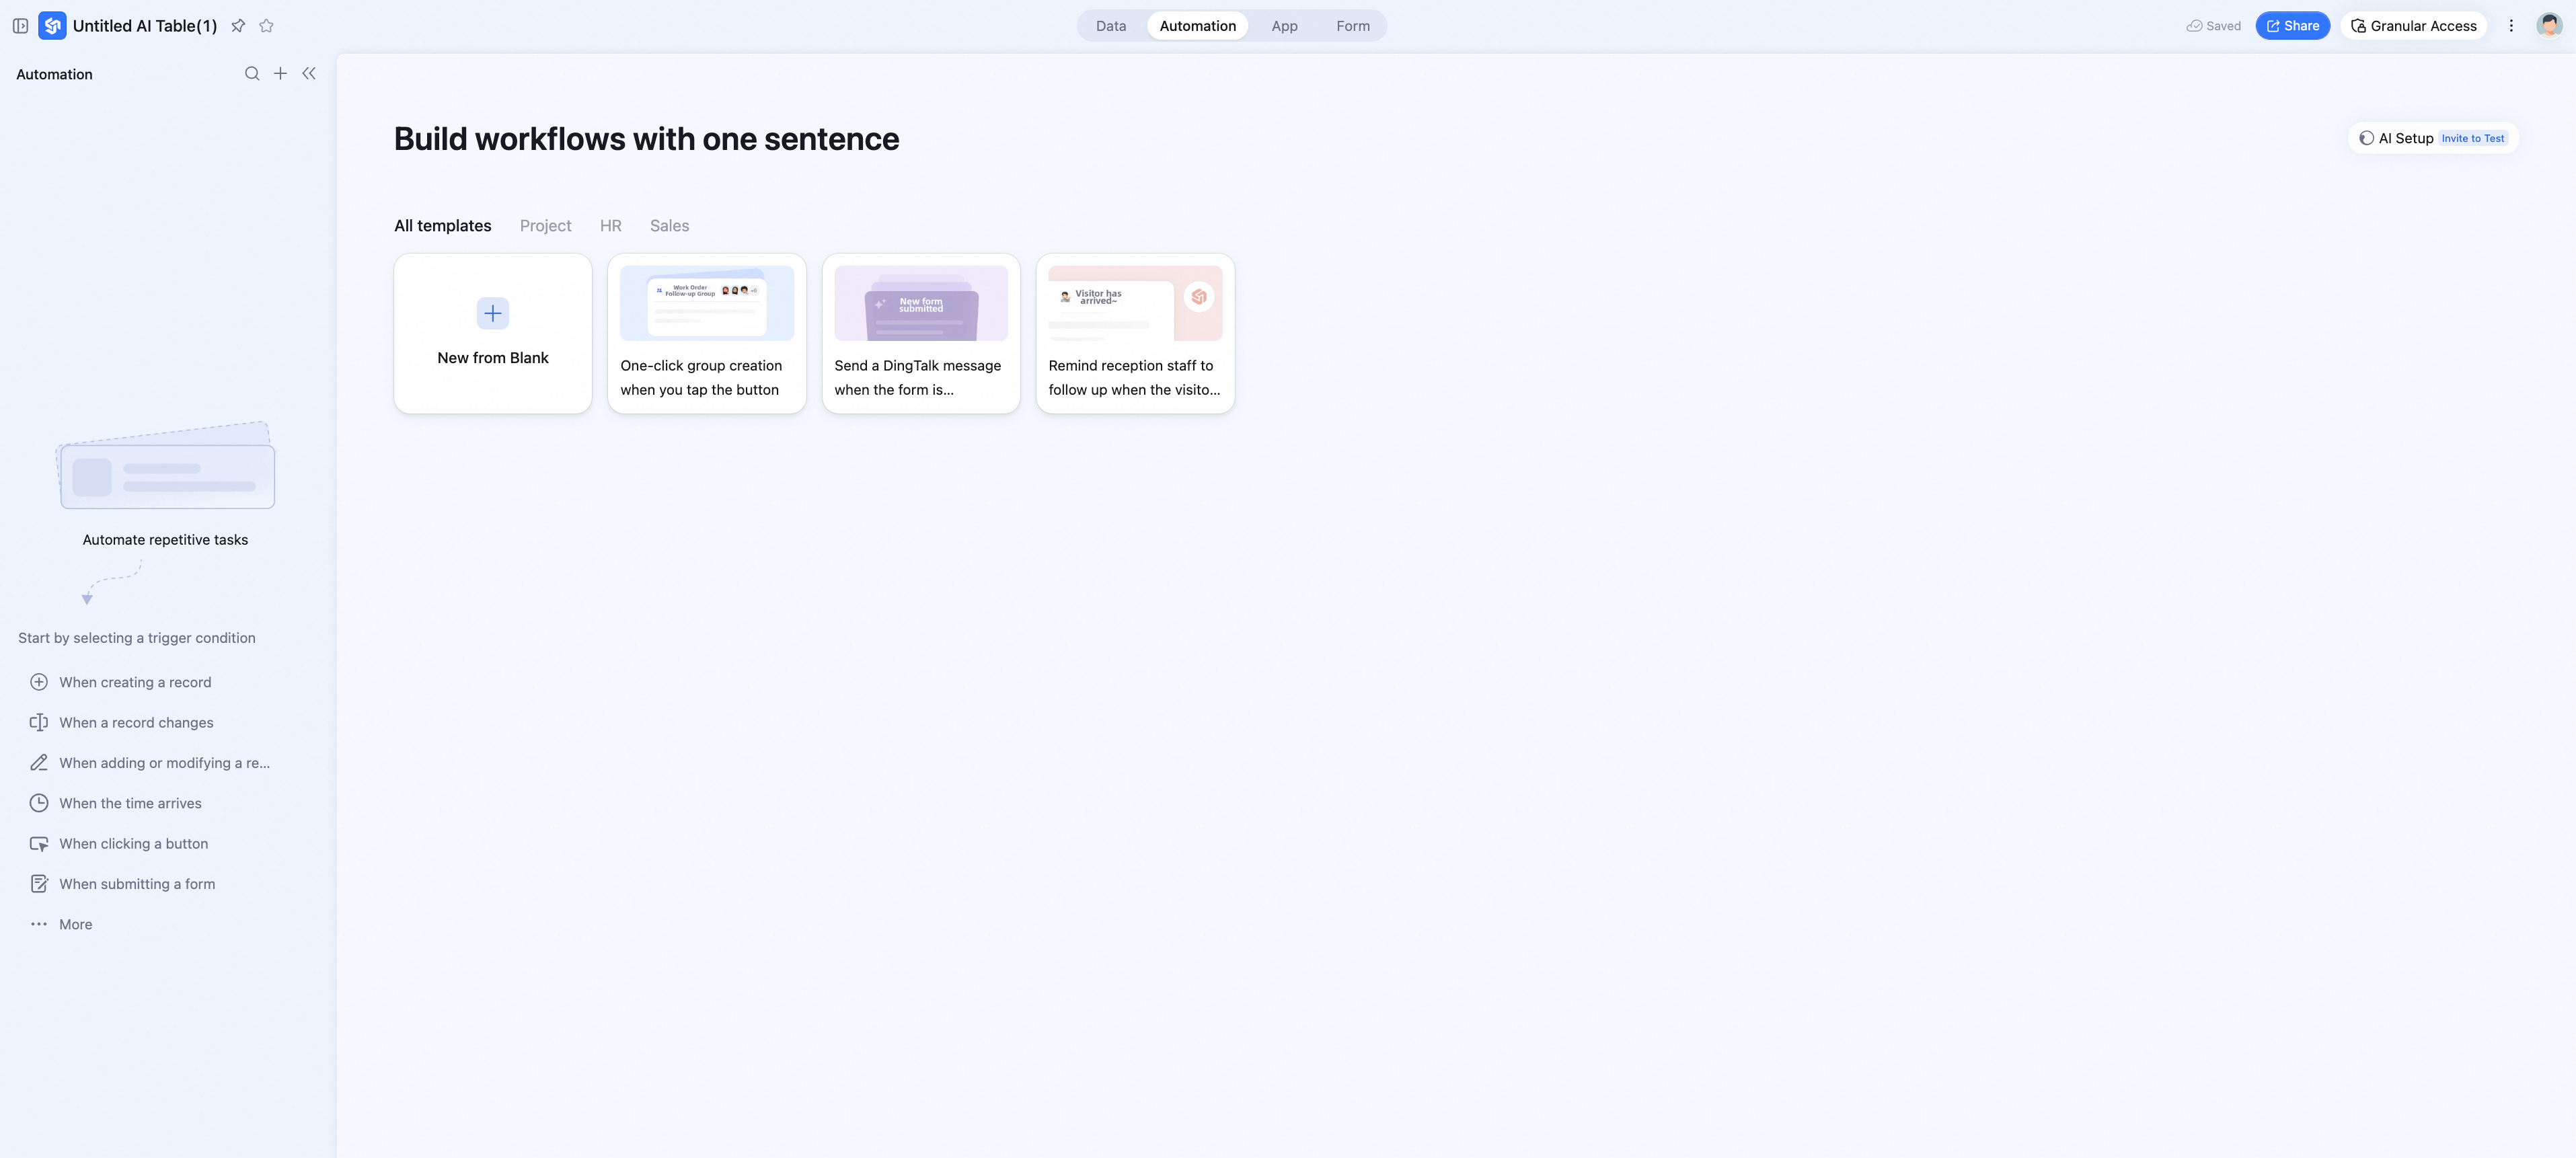
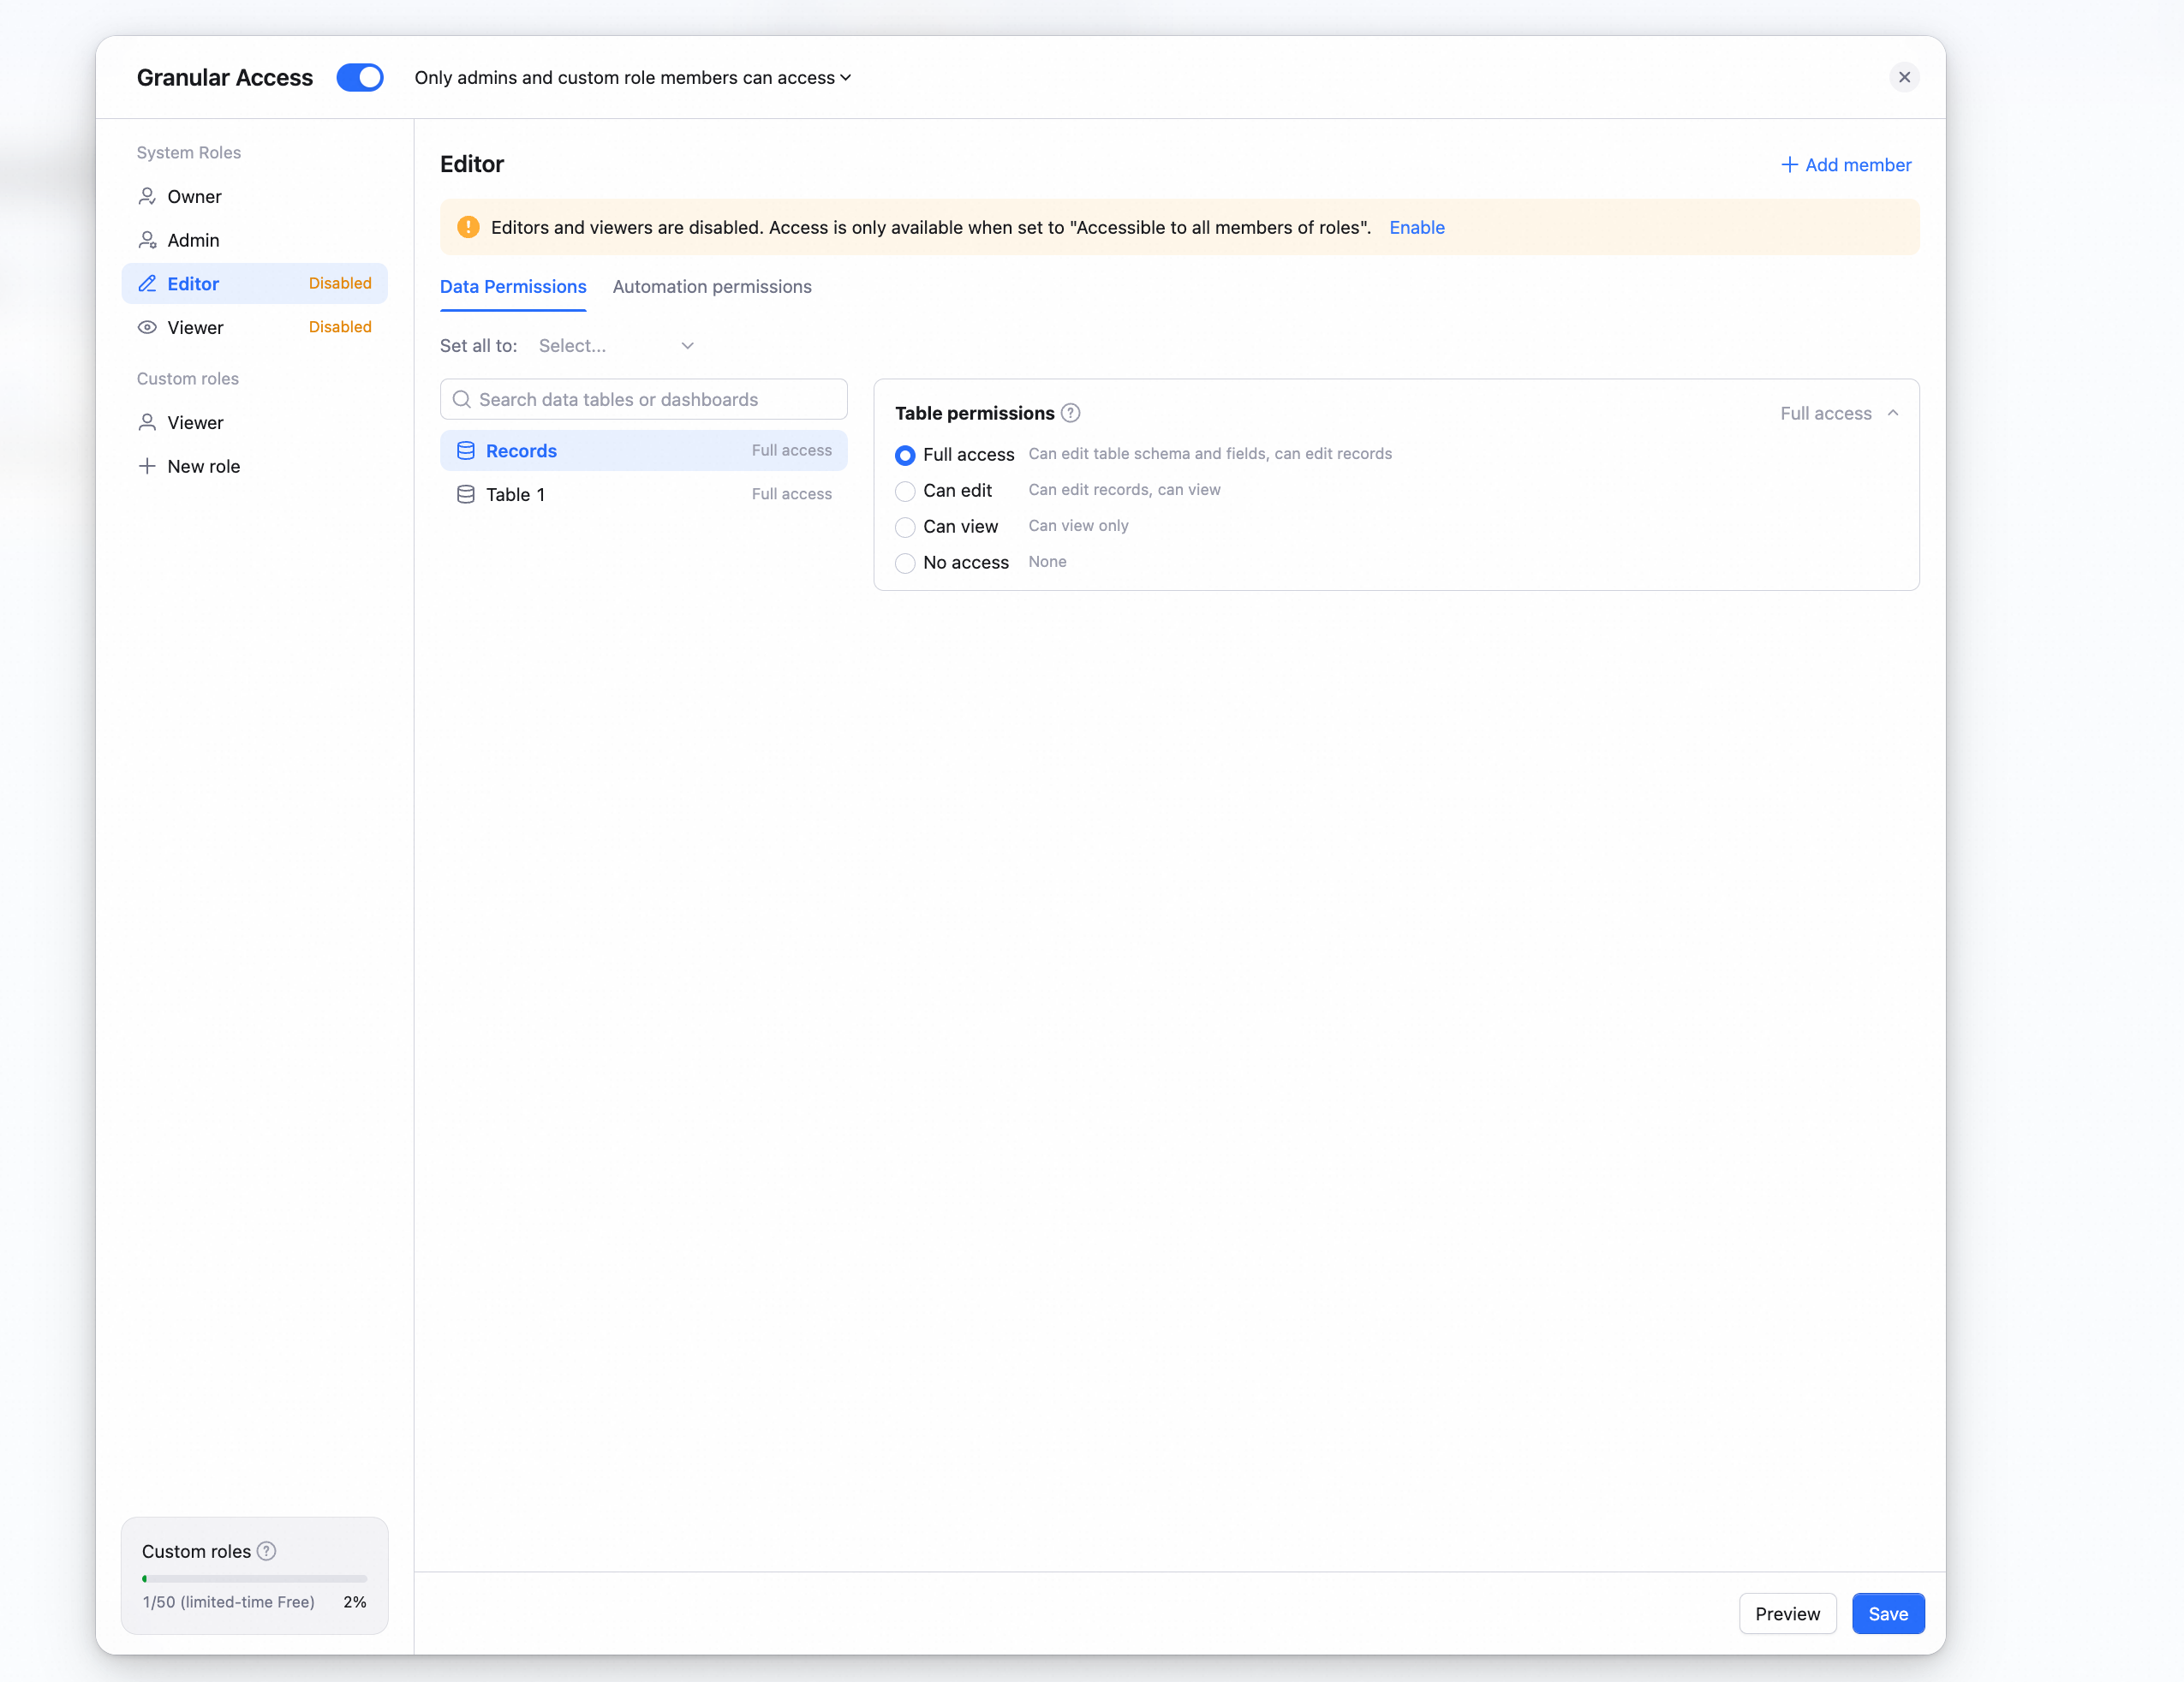
Advanced Permissions
Define custom roles to control exactly who can view and edit each table — granular permissions, stronger data protection. For more, see Working with Advanced Permissions.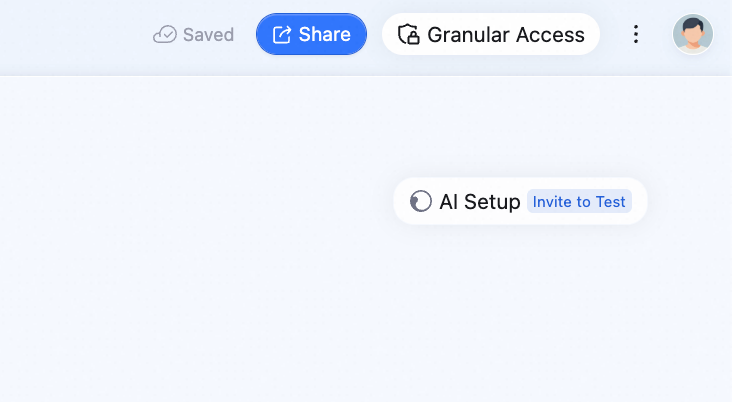
Dashboards
Dashboards turn your AI Table data into a clear, at-a-glance picture. With just a few configuration steps, you can create a live business overview. For more, see Working with dashboards.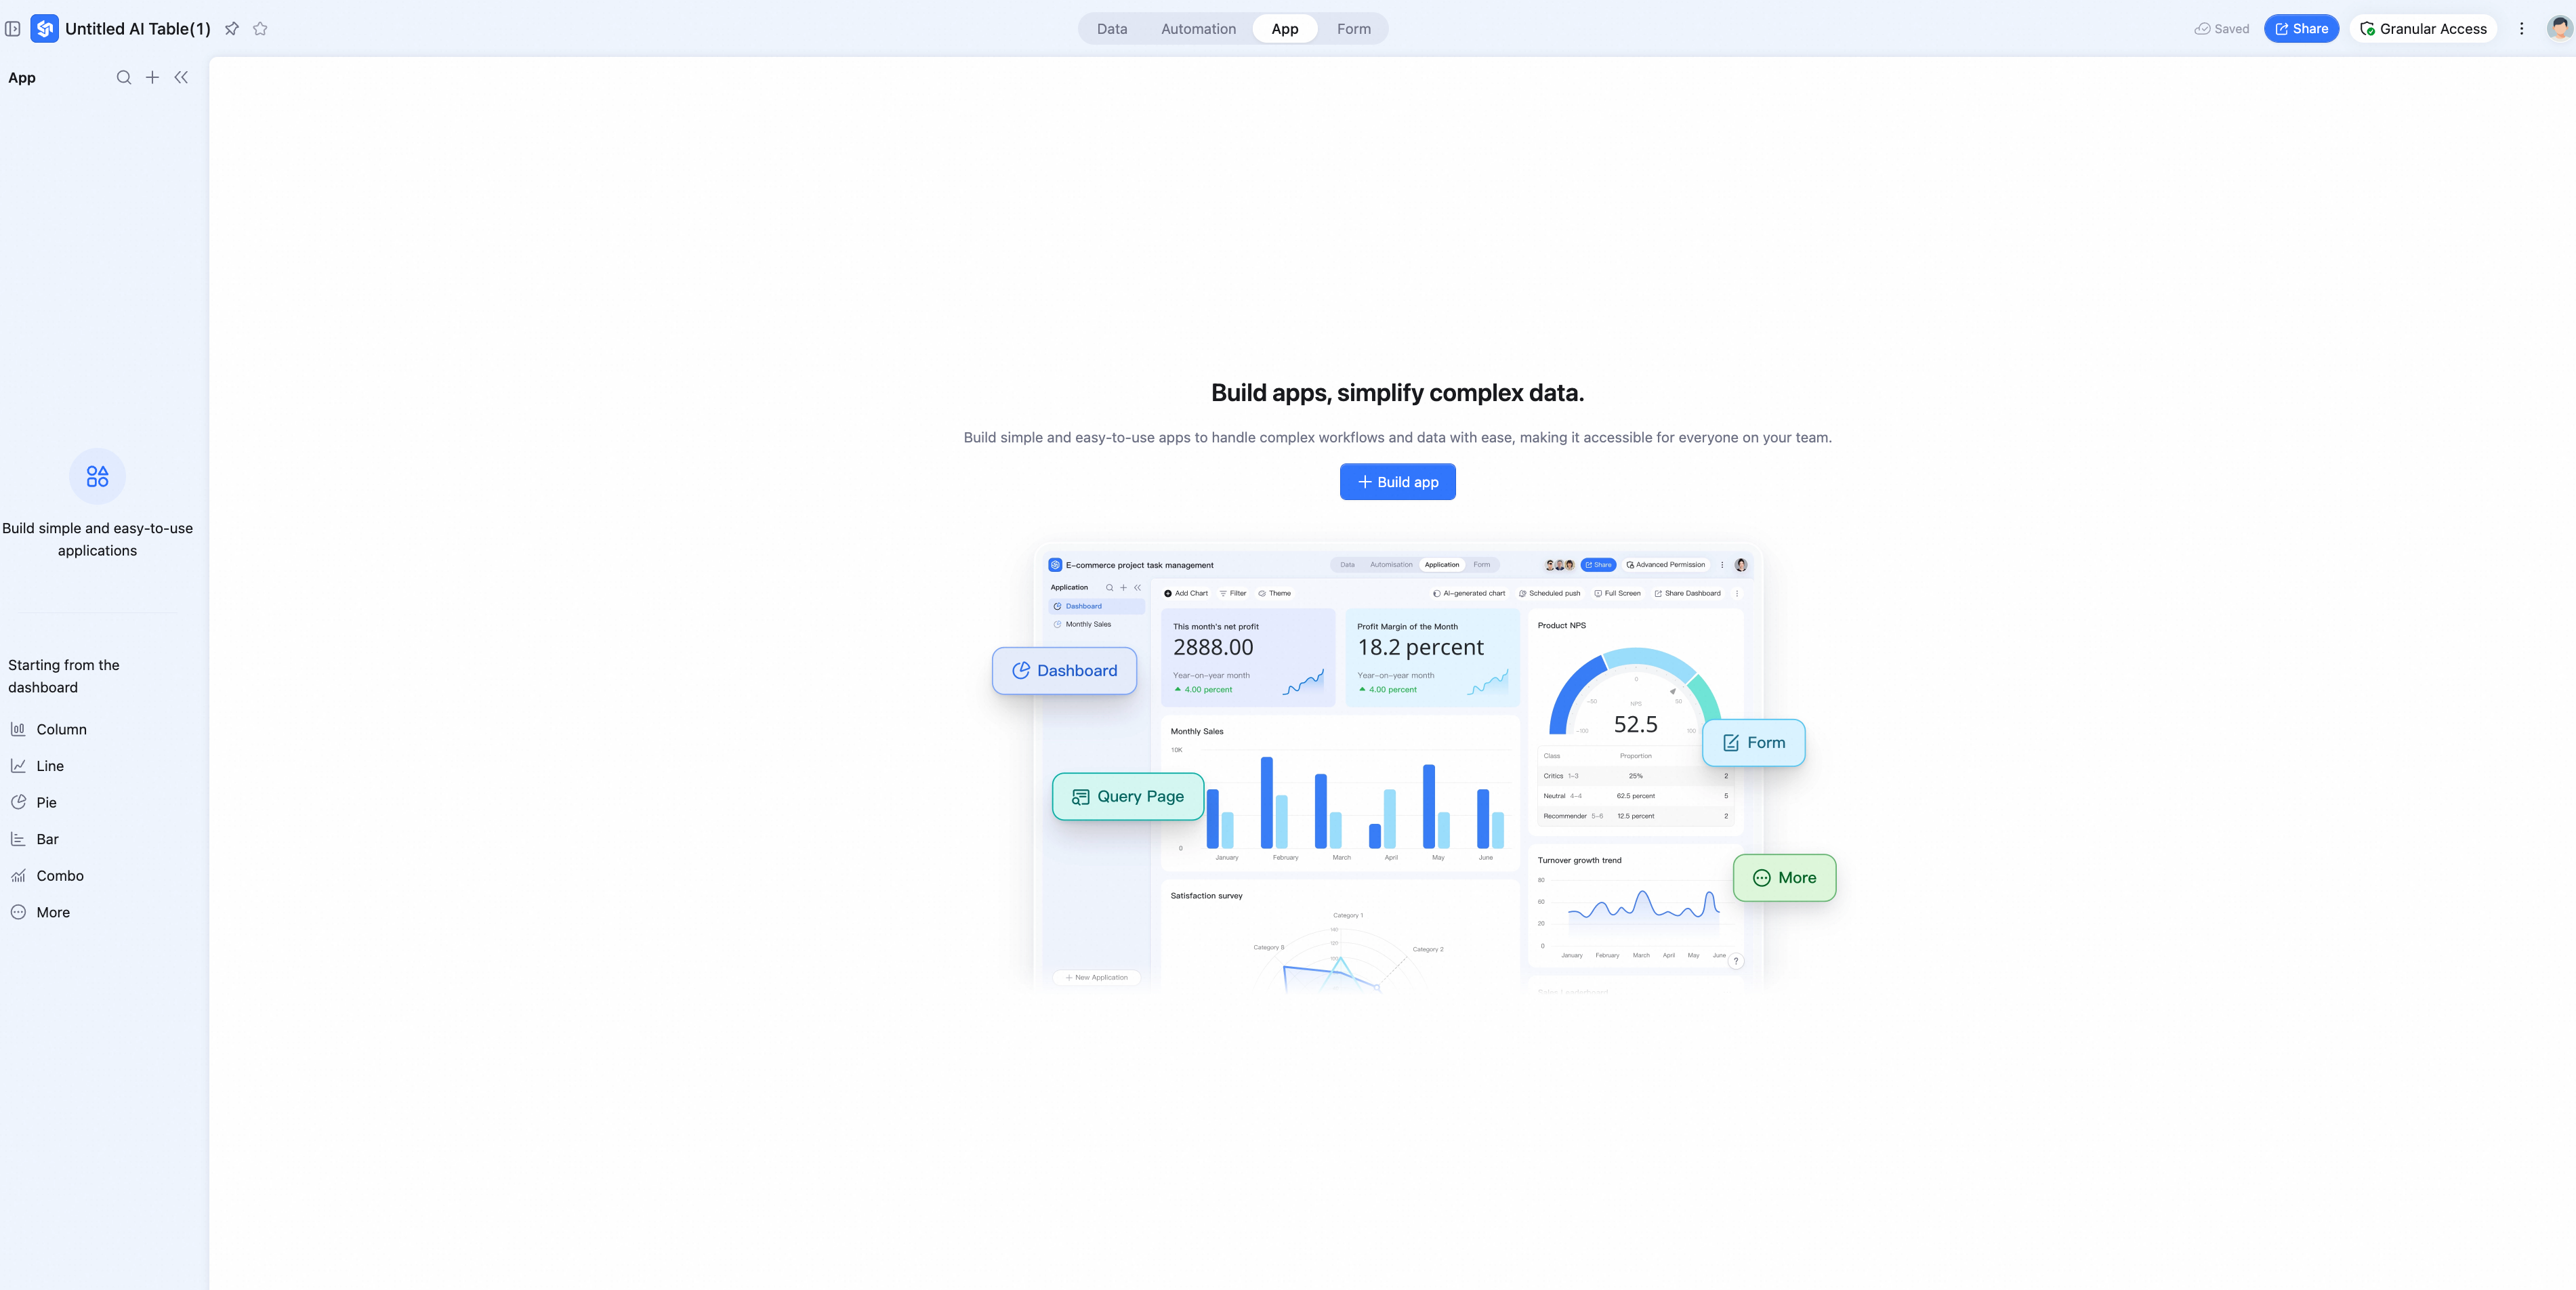
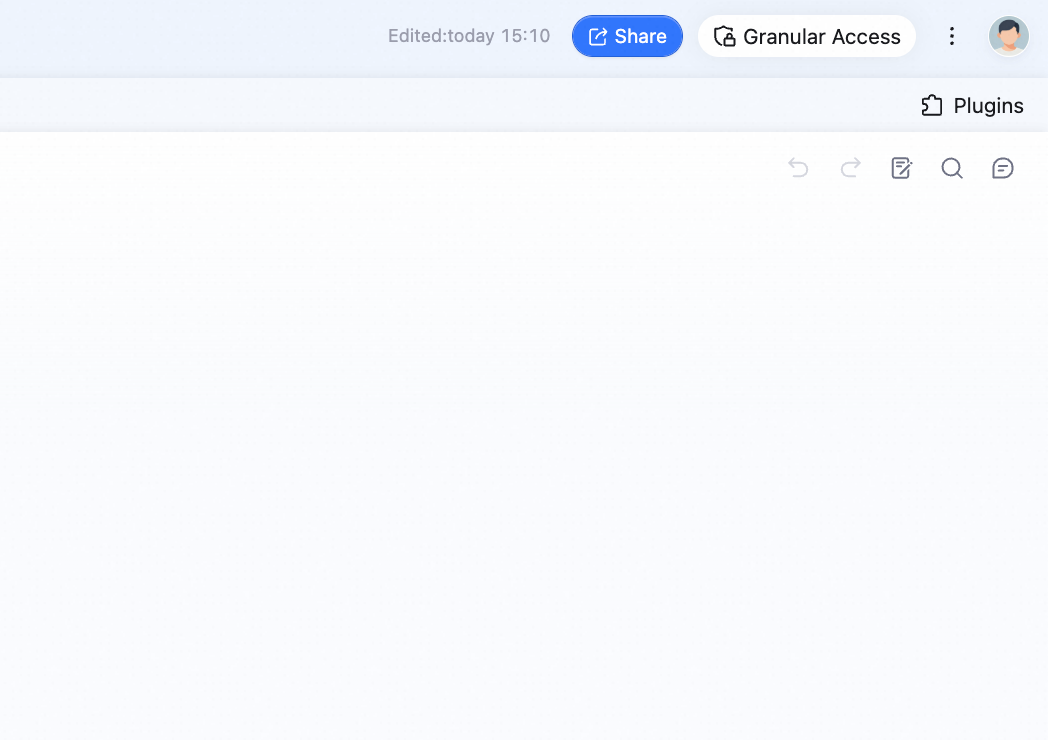
High-fidelity collaboration
Click Share in the top-right corner to share your AI Table with teammates. Invite collaborators, or open access to collaborators only, your whole organization, or the public internet — share via link or QR code.