Create a Gantt view
Click the + icon at the right of the view title bar, pick Gantt view.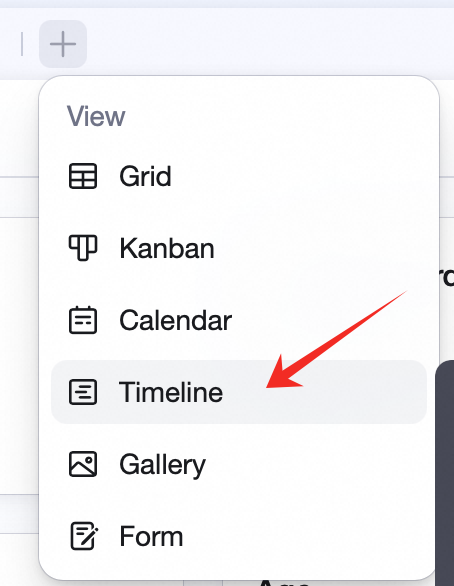
Configure a Gantt view

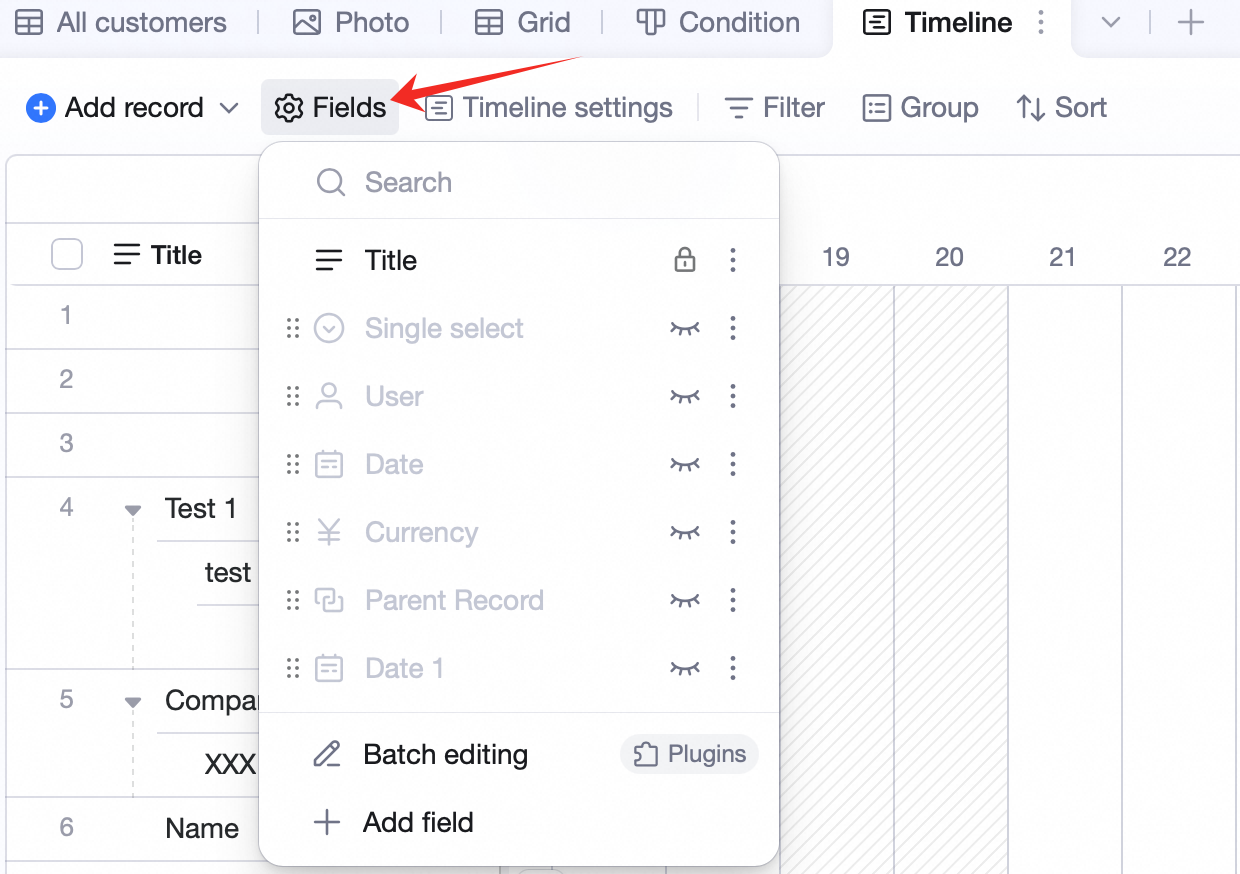
Field management
Click Field management in the toolbar — drag the icon on the left to reorder, click the eye on the right to show/hide, click the icon on the right to edit or delete. Note: the primary field can’t be deleted, hidden, or moved. Reorder / show-hide changes in Gantt view don’t affect other views; edits and deletions sync to other views.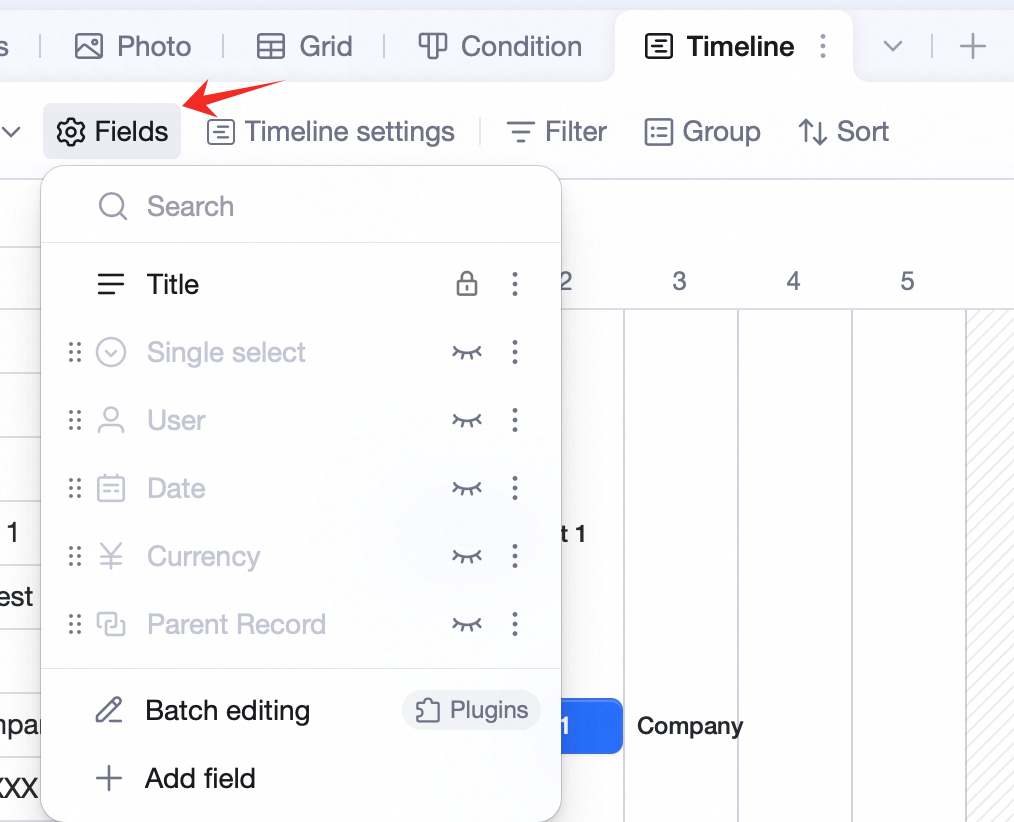
Gantt config
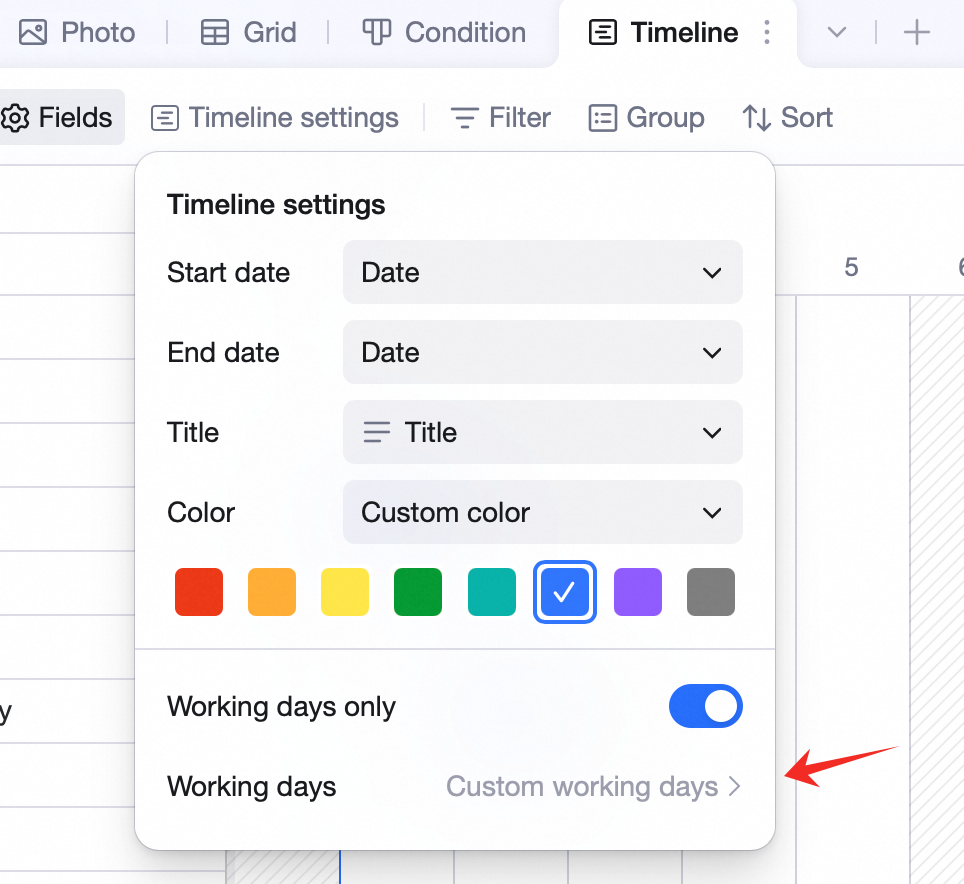
Click Gantt config in the toolbar to set: start date, end date, title, color, work-day config. Start / End date: pick date fields — these define the bar’s start and end. Title: pick a field — its value shows on the bar. Color: pick a custom color from a few presets, or Follow field color. The latter requires a single-select field — bar color matches the option color.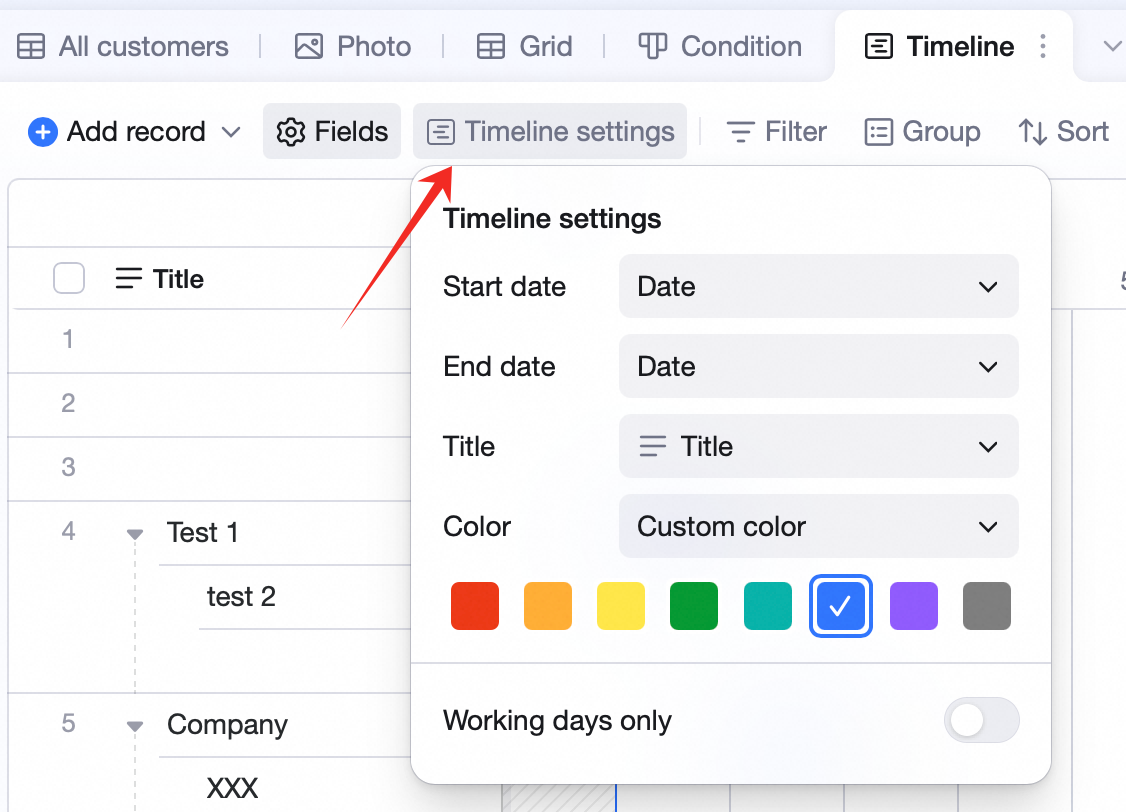 Work-day config: toggle work-days-only, customize work days.
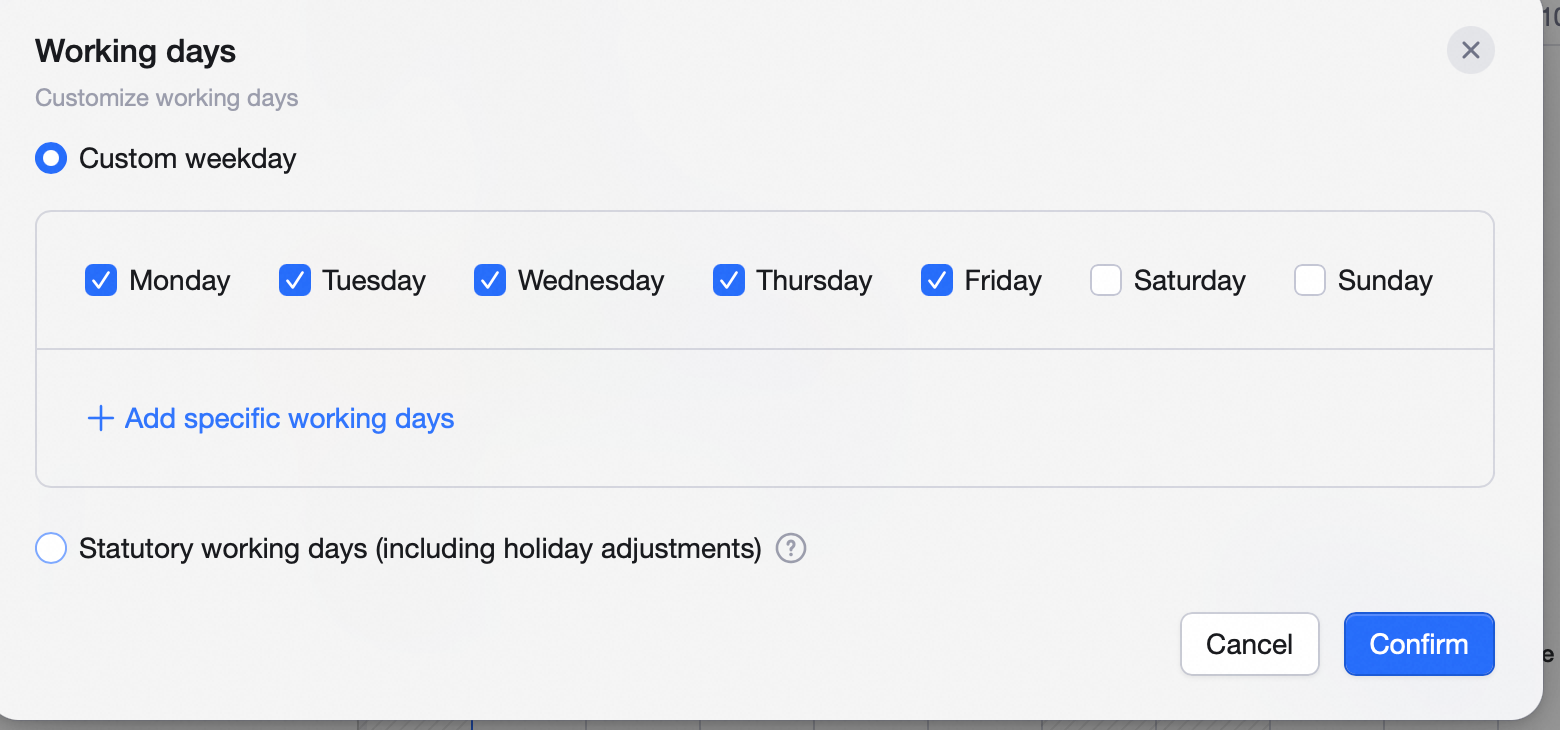
 Pick Custom weekly schedule to choose which days are work days. Click + Add other work days and click dates in the calendar to adjust.
Pick Statutory holidays (incl. compensation days) to follow government-published rules.
Pick Custom weekly schedule to choose which days are work days. Click + Add other work days and click dates in the calendar to adjust.
Pick Statutory holidays (incl. compensation days) to follow government-published rules.
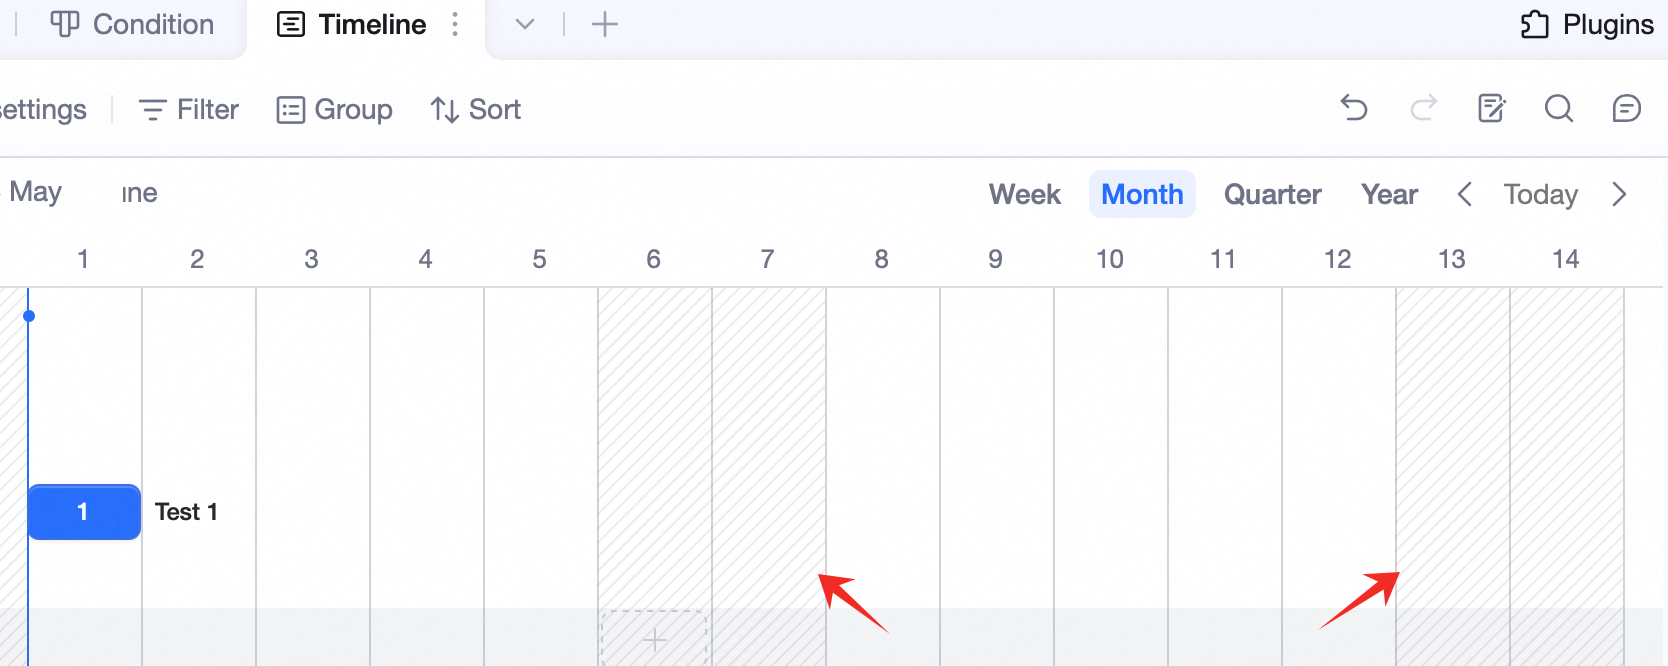
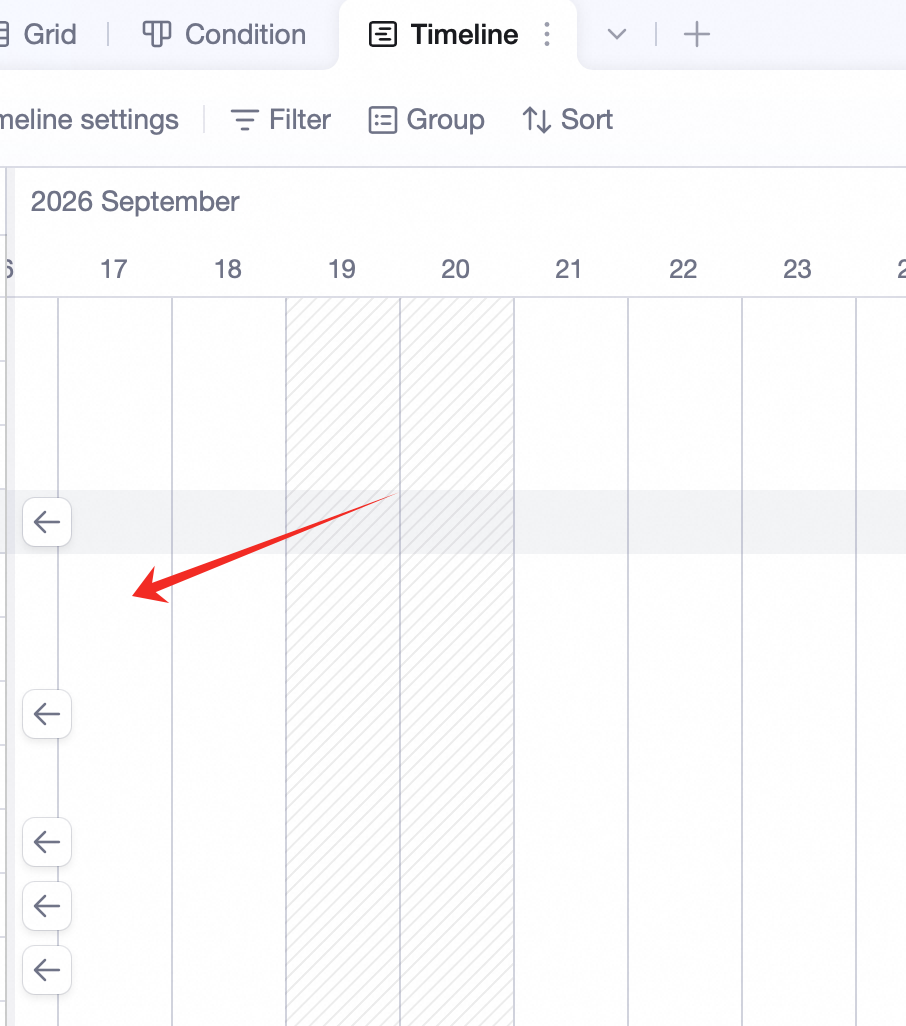
 In Gantt view, non-work days have a shaded background.
Edit a Gantt view
View
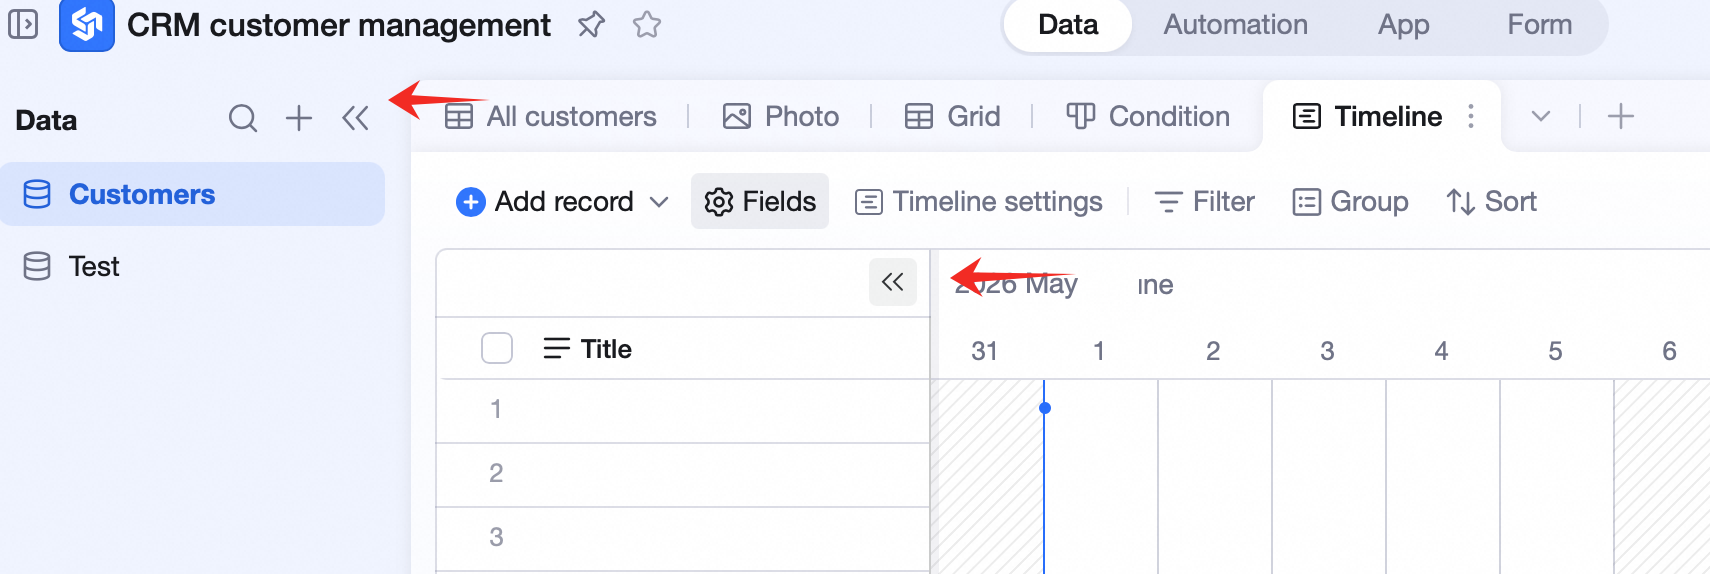
- Click << next to the top-left nav to fold the table sidebar.
- Click << at the top-right of the field area to collapse all left fields, expanding the Gantt area to the full screen.
Add / edit records
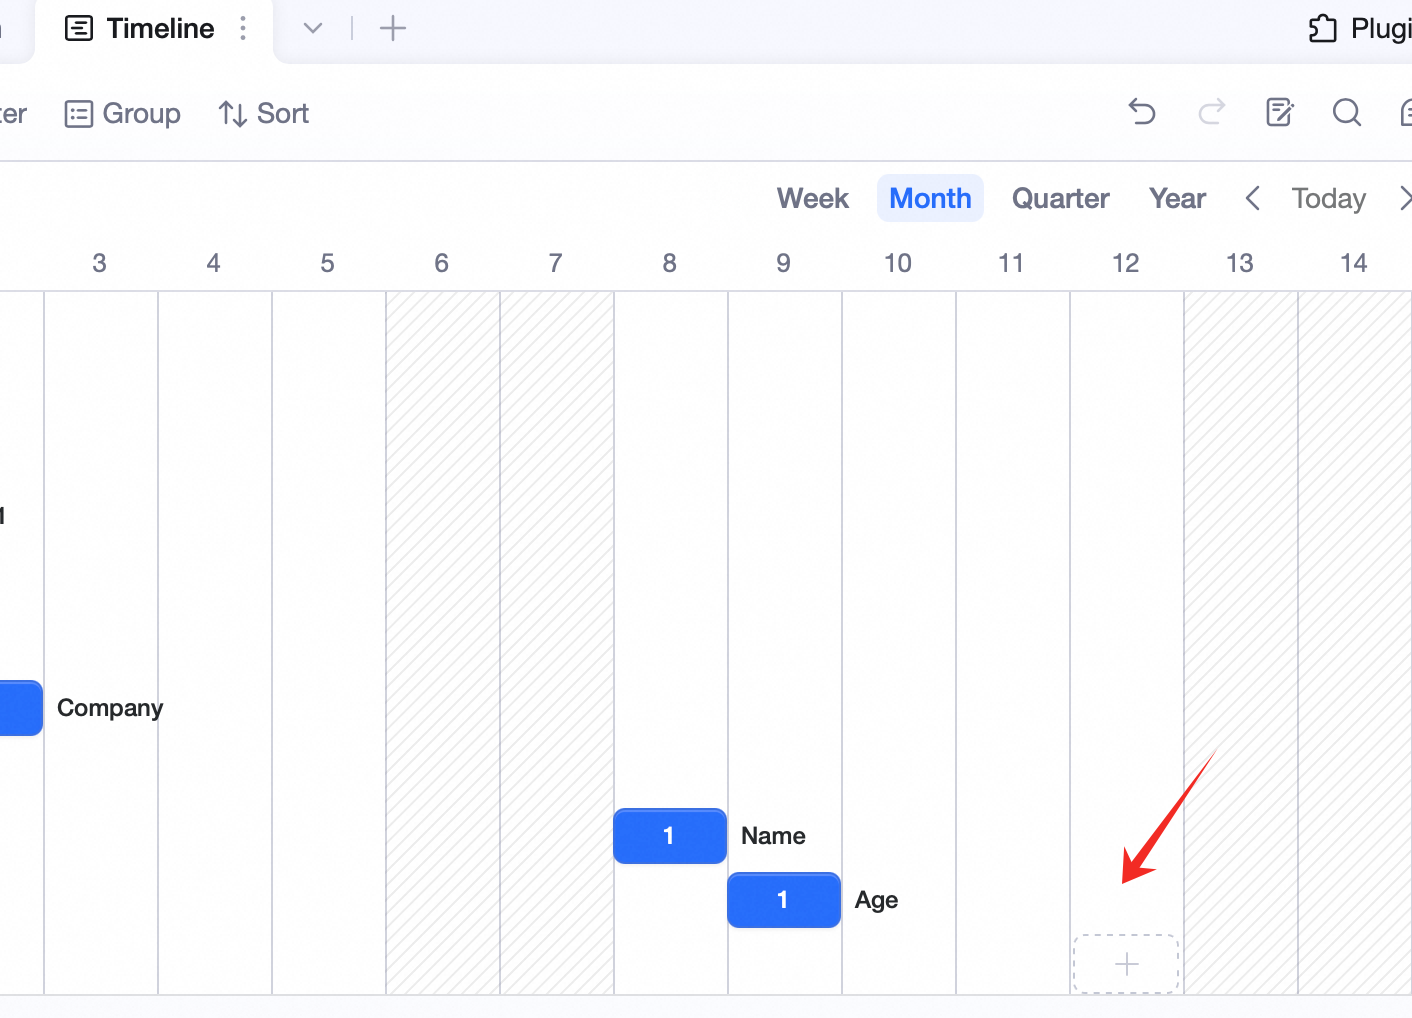
- Hover an empty cell — an addable area appears.
- Click to add a bar.
- Hover a record’s bar — drag to change start / end, or hold and drag the whole bar (not editable when start / end are created-time values).
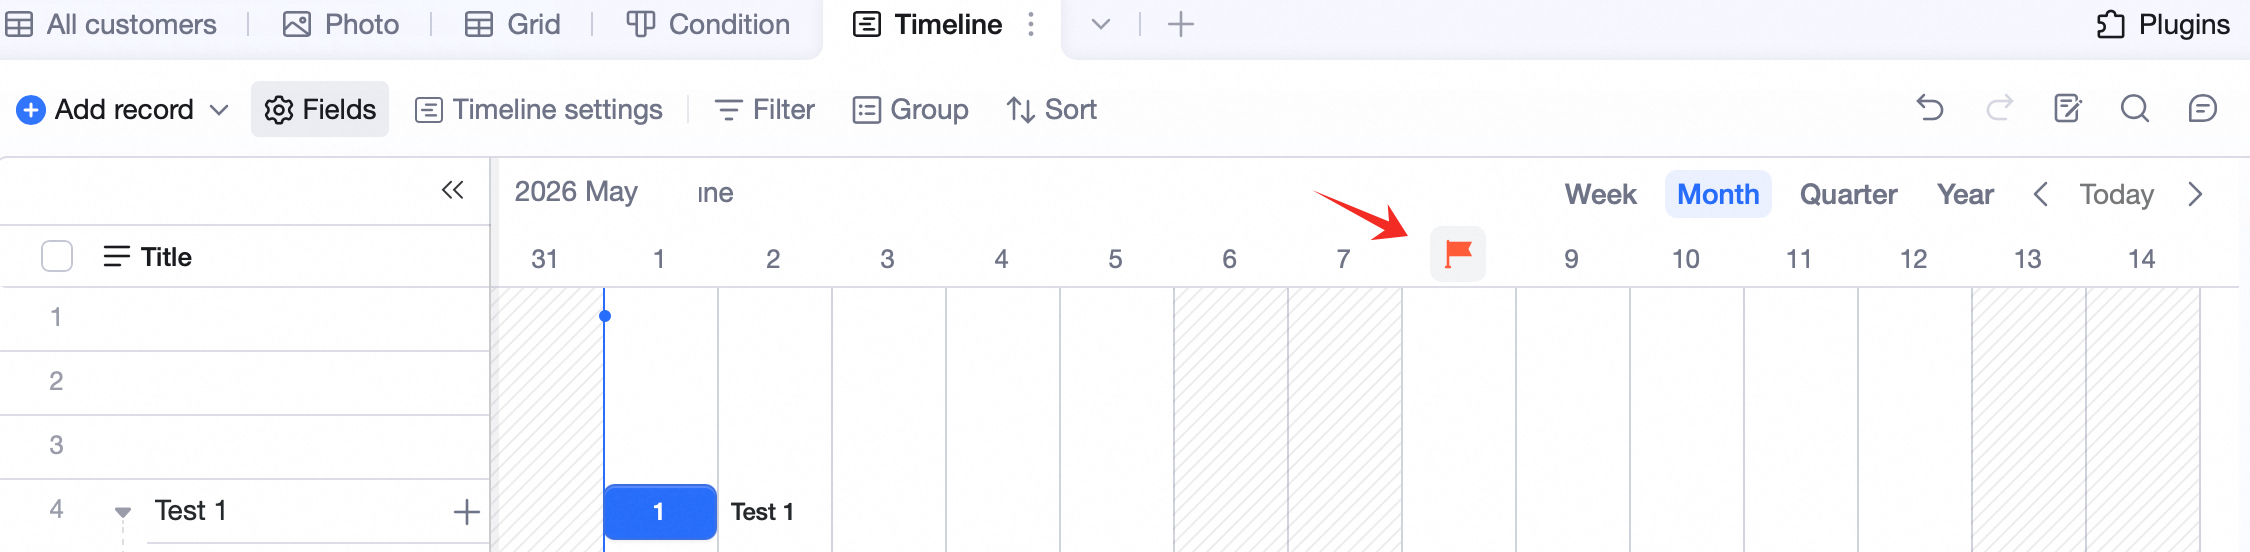
Set a milestone
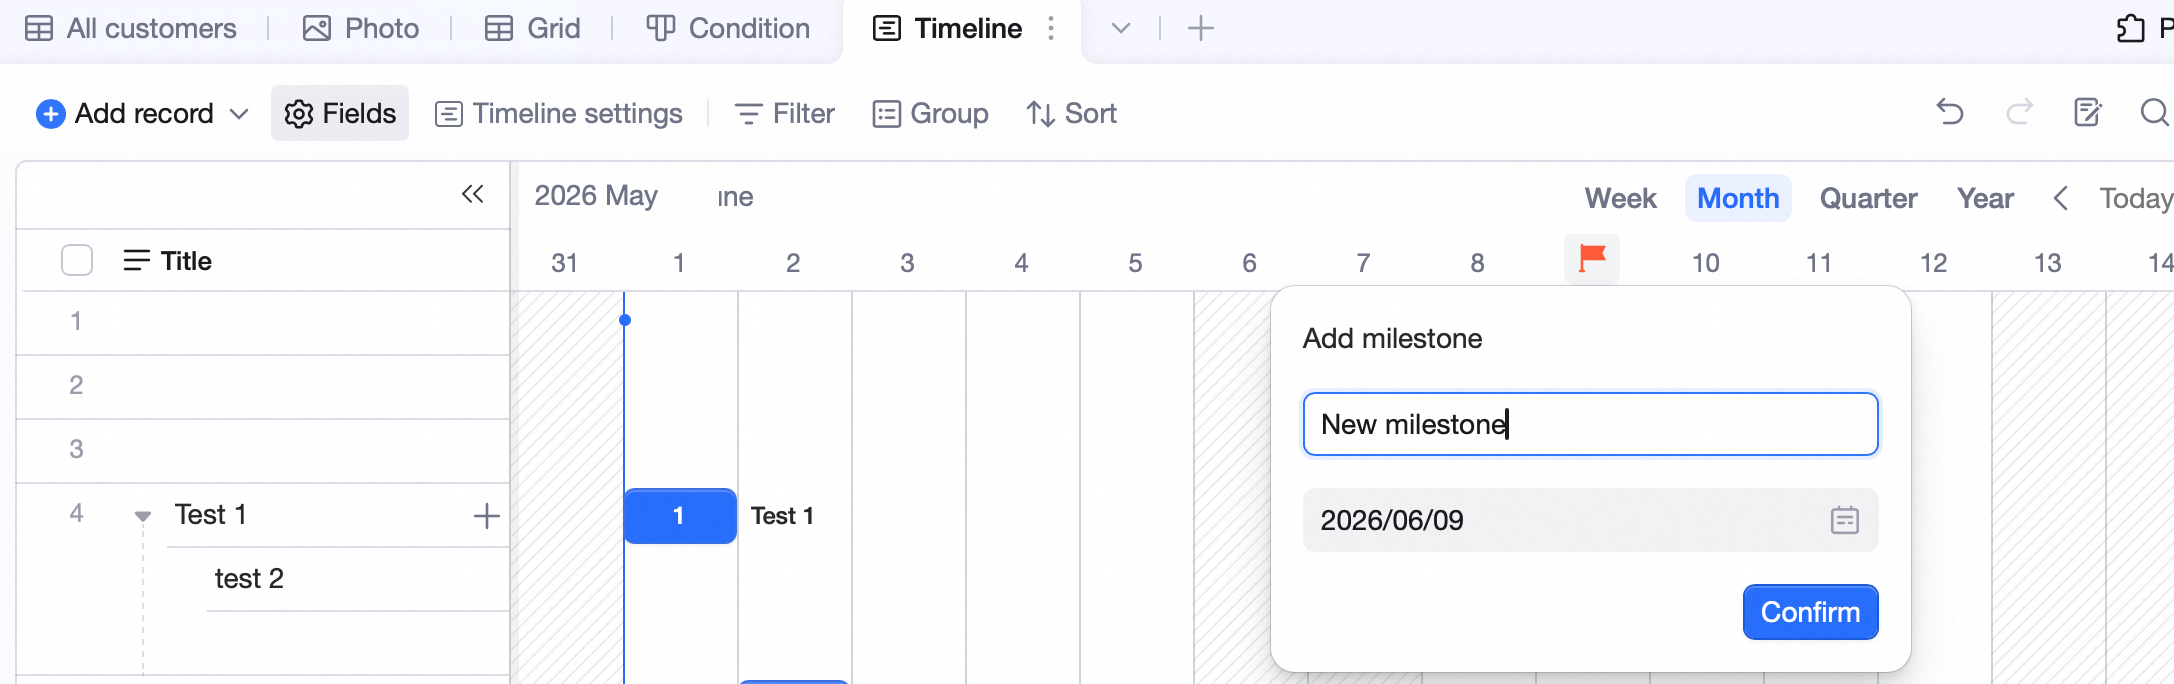
Click to create a milestone. Type the name, press Enter or click outside to save. To edit or delete, click the name to edit or delete the milestone.- Hover any date in the Gantt timeline — a flag icon appears.
- Click the flag to add a milestone.
- Enter milestone title and date.
Time scale
Gantt view supports Year / Quarter / Month / Week — switch in the top-right. Click Today in the top-right to jump to today.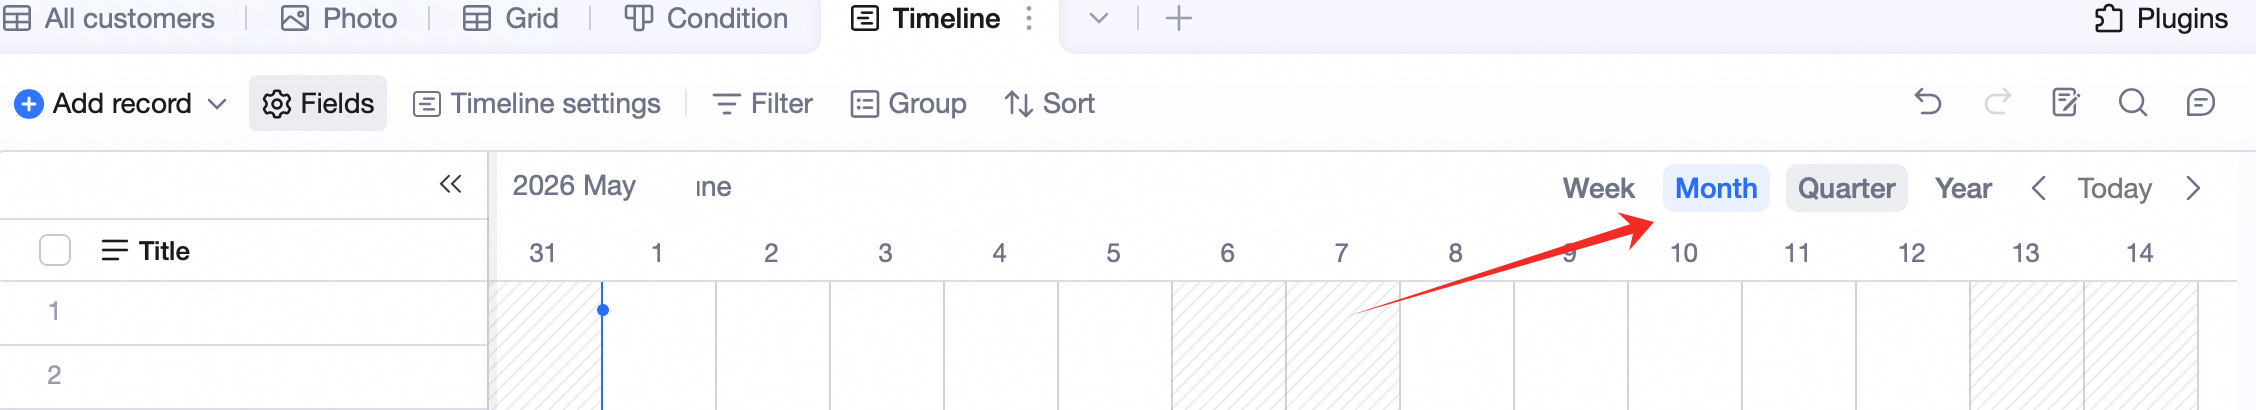 When a bar is out of view, click ← or → on either side of the bar to jump to its start or end.
Field management
Pin fields on the left of the Gantt view — they stay put on horizontal scroll.- Open Field config in the toolbar, click the icon next to a field to control its left-side visibility.
- Or right-click a visible field, pick Hide field / column.