Set filters in a dashboard to view data and charts from different angles. Common scenarios: Market analysis: in a market analytics dashboard, different teams or regions can filter to see trends for their own region. • Project management: in a project tracking dashboard, the PM can pick a specific time range or phase to inspect task completion and team performance. • CRM: in a customer dashboard, sales reps can filter by customer group or industry to refine retention strategy.

Basics

Add filters

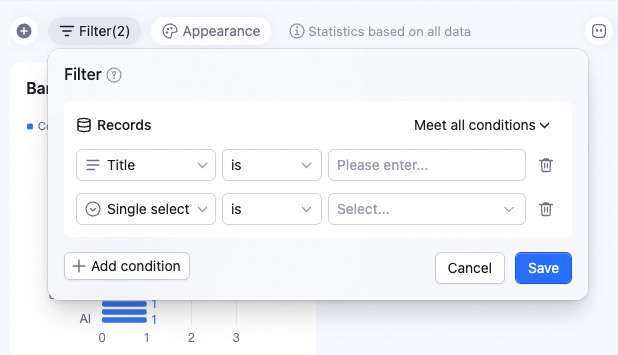
Click Filter in the upper-left of the dashboard. In the popup, click + Add condition to add one or more filters. Click Save to apply. All collaborators see the filtered result.
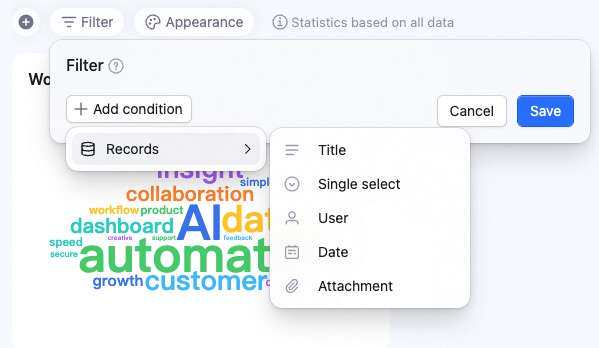
Delete a filter

In the filter panel, click the icon to delete a filter. Click Save to apply.

FAQ

Q: Who can filter dashboard data?

A:
Without advanced permissionsThe AI Table owner, managers, and editors can filter. Readers can’t yet.
With advanced permissions onOnly the owner and managers can. Others can’t.

Q: If I filter, does it affect what others see?

A: Once saved, all collaborators see the filtered chart.

Q: Can shared dashboards be filtered?

A: Not yet. The shared dashboard shows only the filtered data and charts — the recipient can’t change filters.

Q: When duplicating a dashboard or AI Table, are filters preserved?

A: Yes.

Q: Can I filter on mobile?

A: Not yet — mobile is view-only on the filtered dashboard.