Chats
Chats Calendar
 Meetings
 Contacts
 Mail
Mail Docs
Docs Drive
Drive AI Table
 AI Minutes
 Attendance
 Approval
 YiDA
YiDA Admin Console
1. Background
Before you learn how to debug YiDA pages, keep the following in mind:- YiDA is currently built on the JavaScript ecosystem.
- YiDA is currently built on the React ecosystem.
- YiDA’s component system is currently based on Fusion, an open-source component library from Alibaba Group.
2. Debug JavaScript
Chrome is the recommended browser for debugging code. For step-by-step guidance, refer to this article (English) or this article (Chinese).3. Debug React
Debug with React Devtools. For detailed instructions, see this article.4. Debug JS Code Written in the Action Panel
(1) Open the developer console. On macOS, press Cmd + Option + I, or right-click and select “Inspect”. On Windows, press F12, or right-click and select “Inspect”.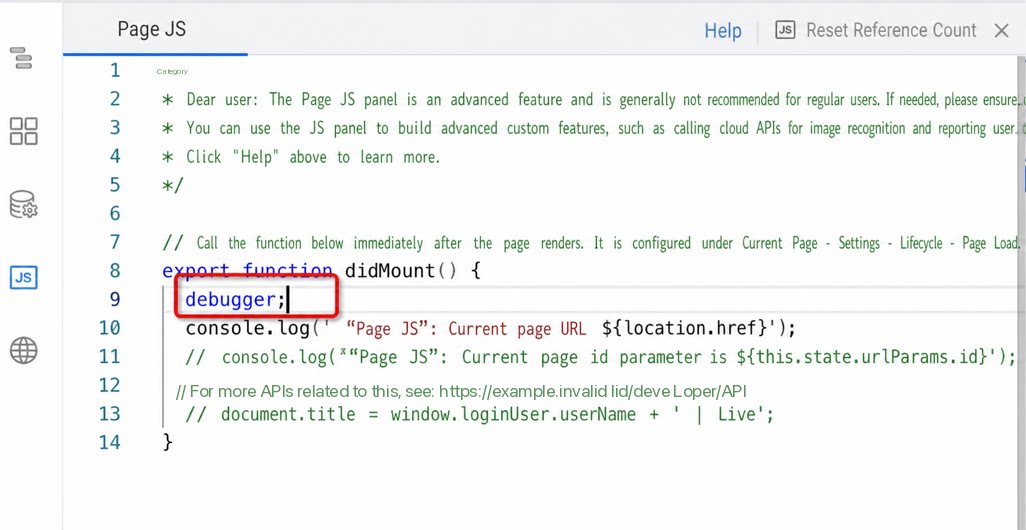
debugger keyword in your code to set a breakpoint for console debugging.
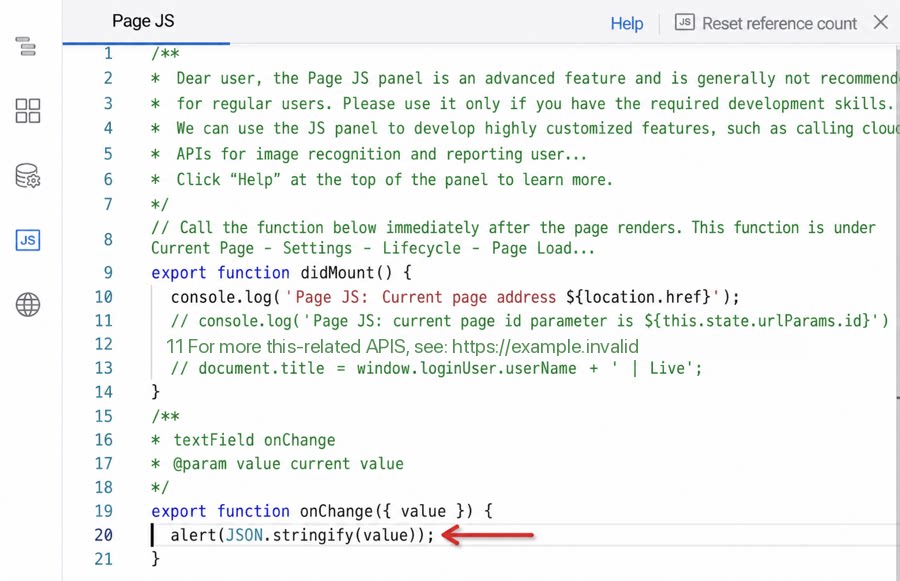
alert() to display values for troubleshooting.
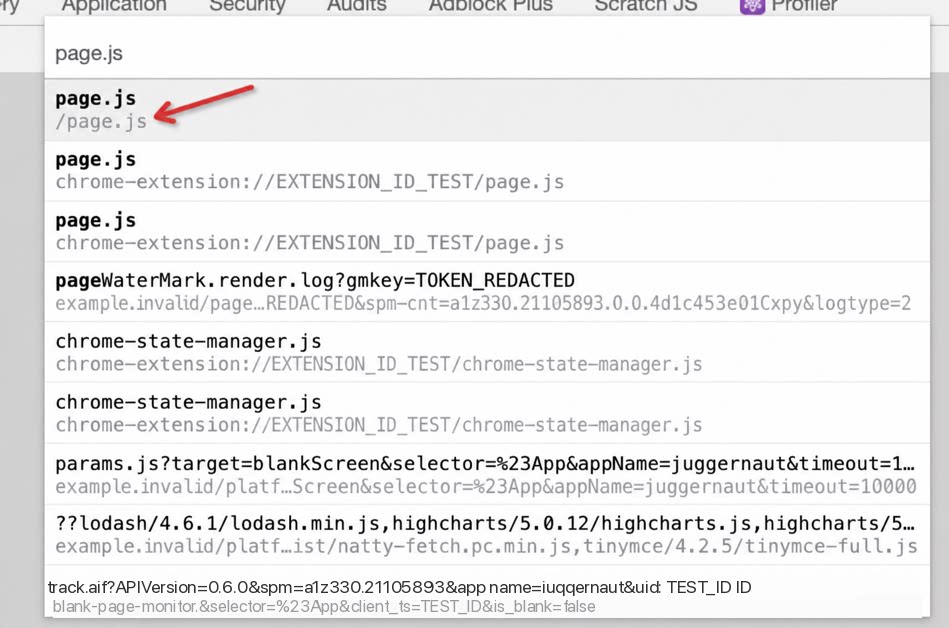
(4) If an error appears in the console, click page.js to enter source code debugging directly.
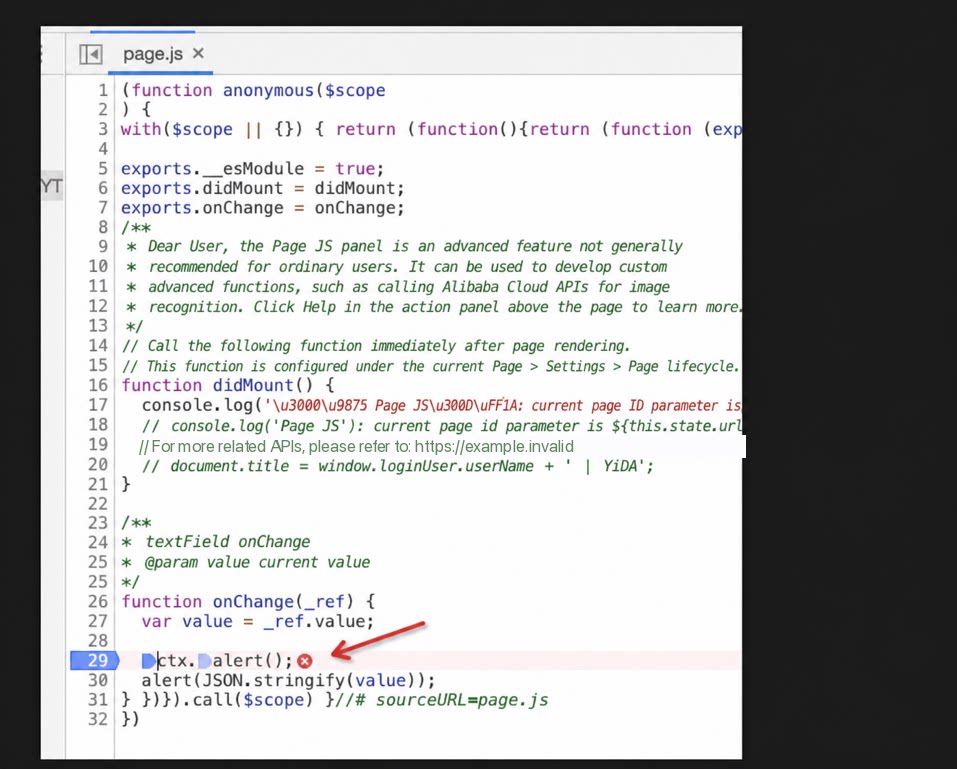
page.js to enter source code debugging.