Chats
Chats Calendar
 Meetings
 Contacts
 Mail
Mail Docs
Docs Drive
Drive AI Table
 AI Minutes
 Attendance
 Approval
 YiDA
YiDA Admin Console
1. Feature Overview
Quickly view To-Do metrics across different process statuses. By default, data is read from the YiDA Task Center.2. Feature Entry
Open any App → Edit portal → To-Do metrics component.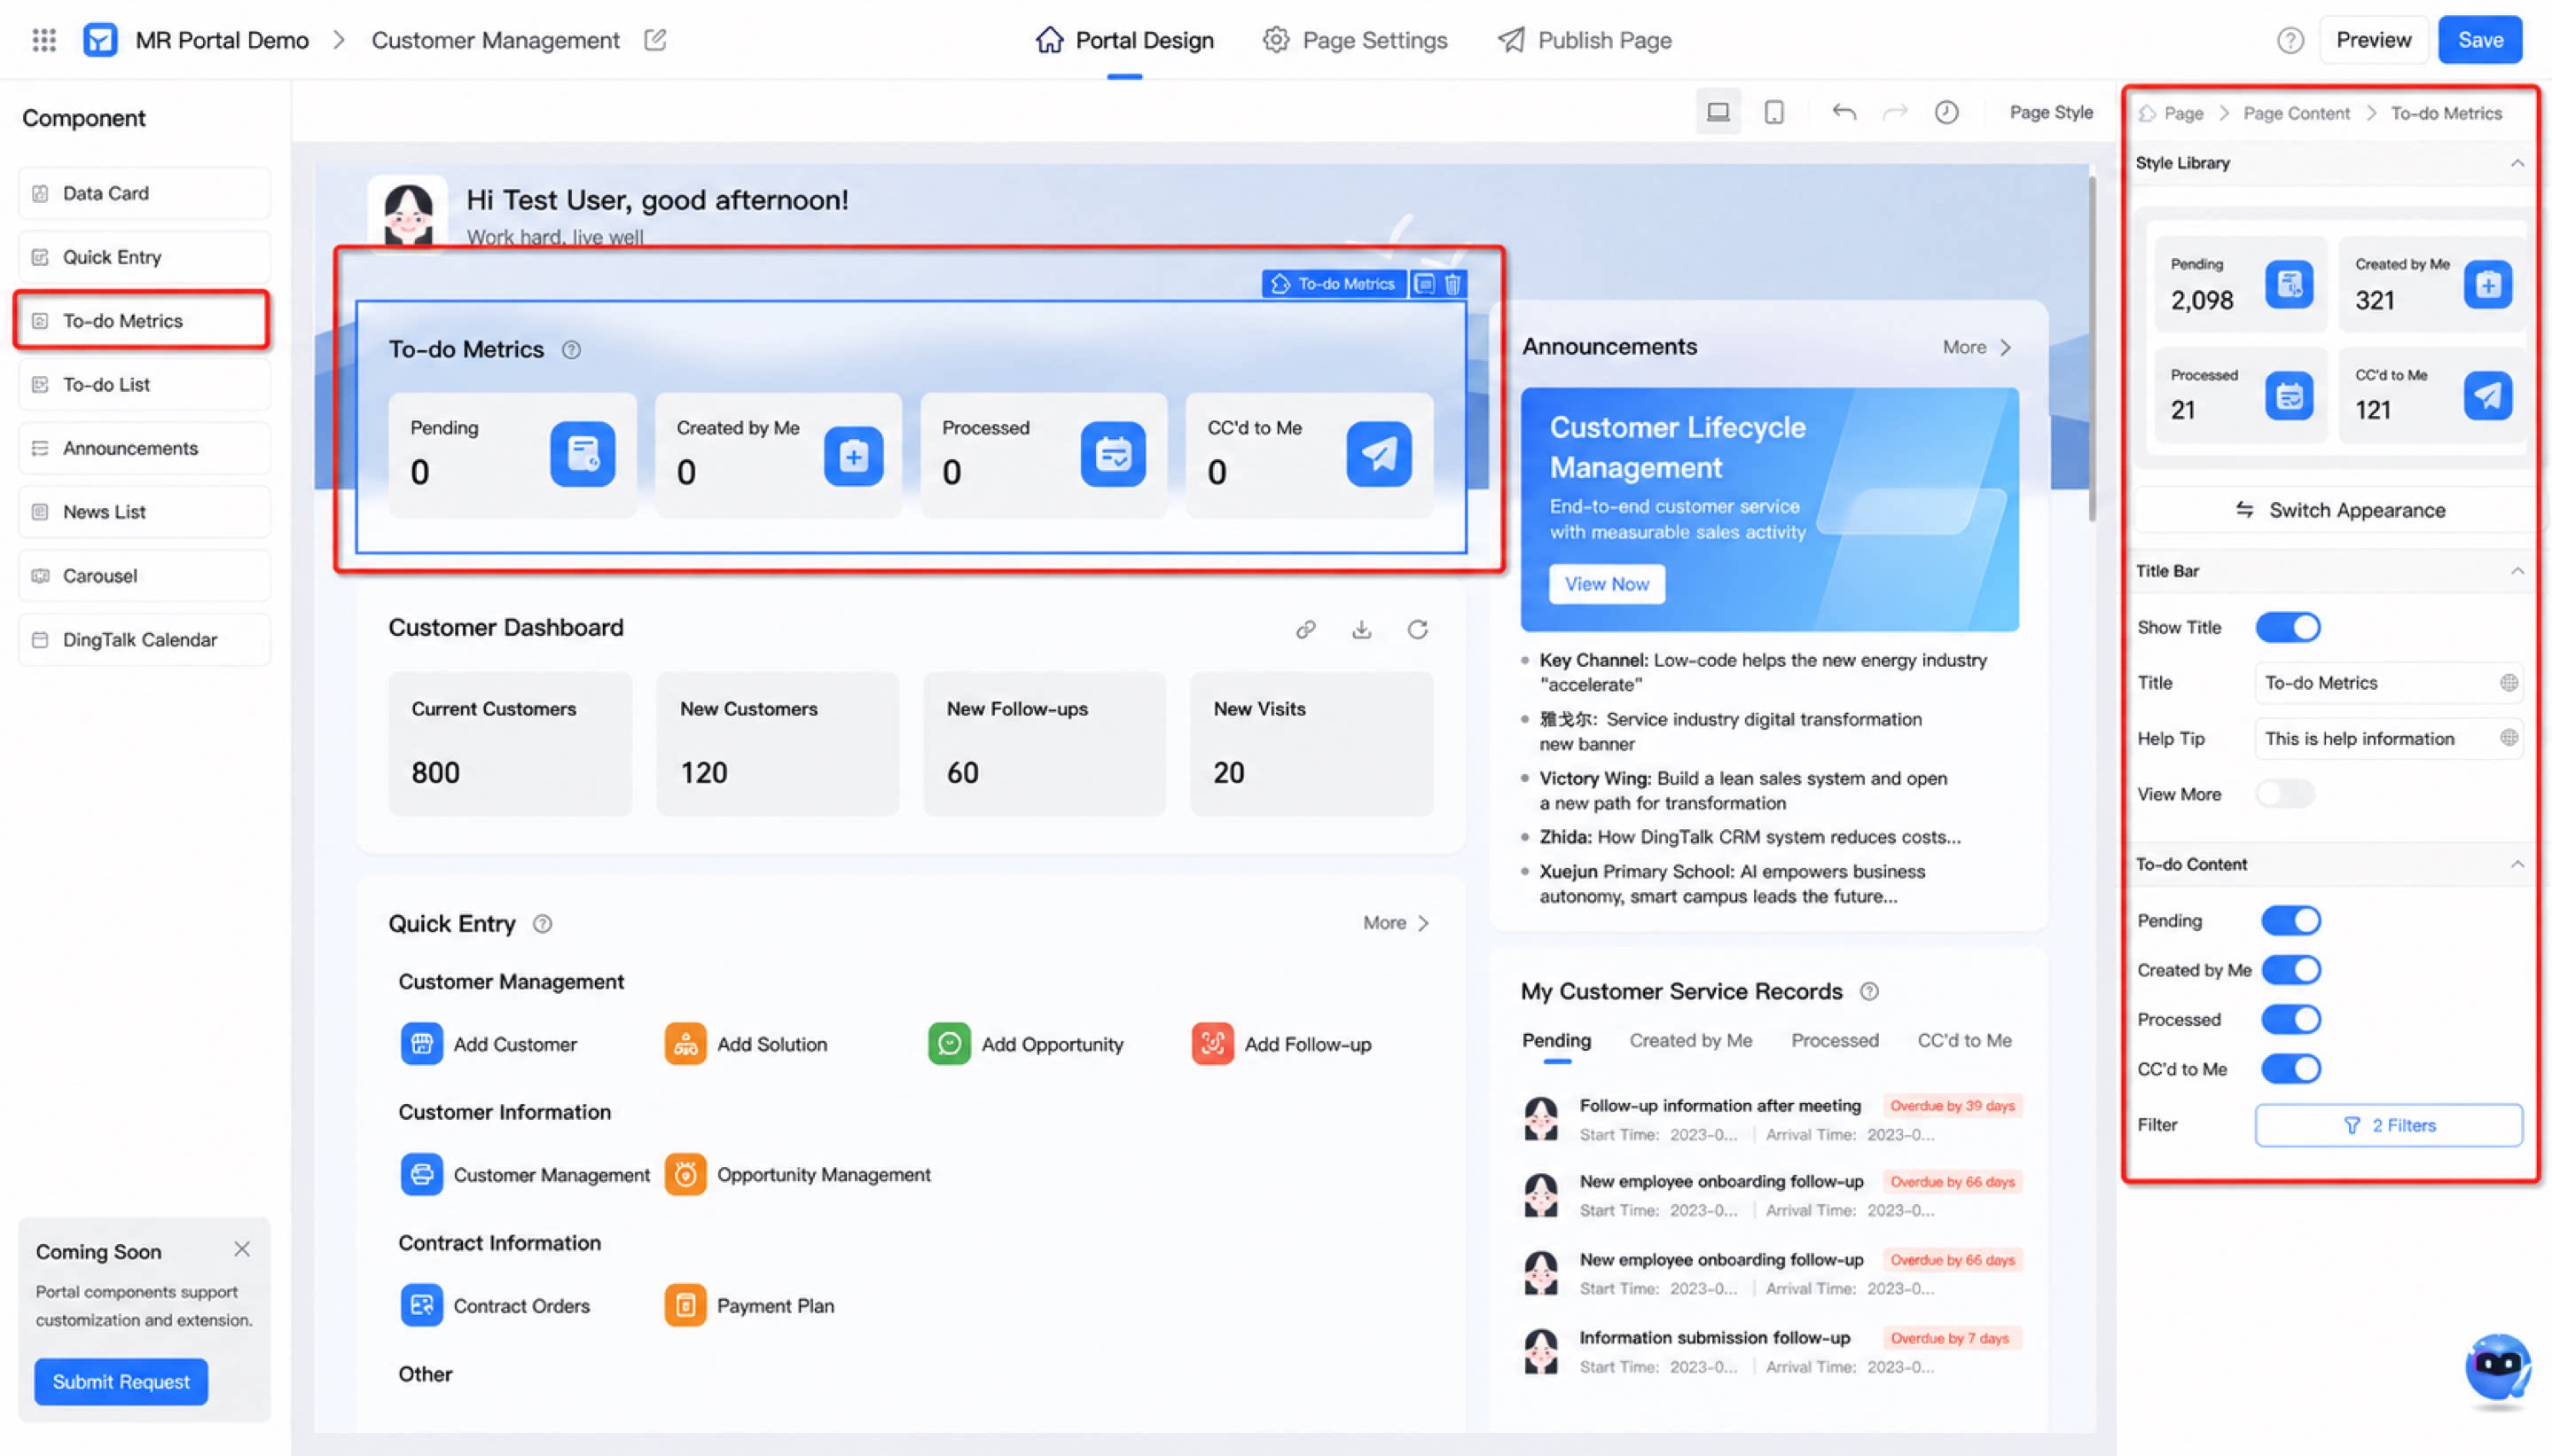
3. Configuration Steps
Adjust the final component appearance by configuring the following component attributes. After adding the To-Do metrics component to the portal, you can:3.1 Switch Component Style
Click the Switch appearance style button to change the component style as needed. Three display modes are currently supported.3.2 Adjust the Title Bar
Control whether to Show title, change the Title name, set Help tips, and toggle the View more option. Once enabled, View more redirects to the YiDA Task Center by default.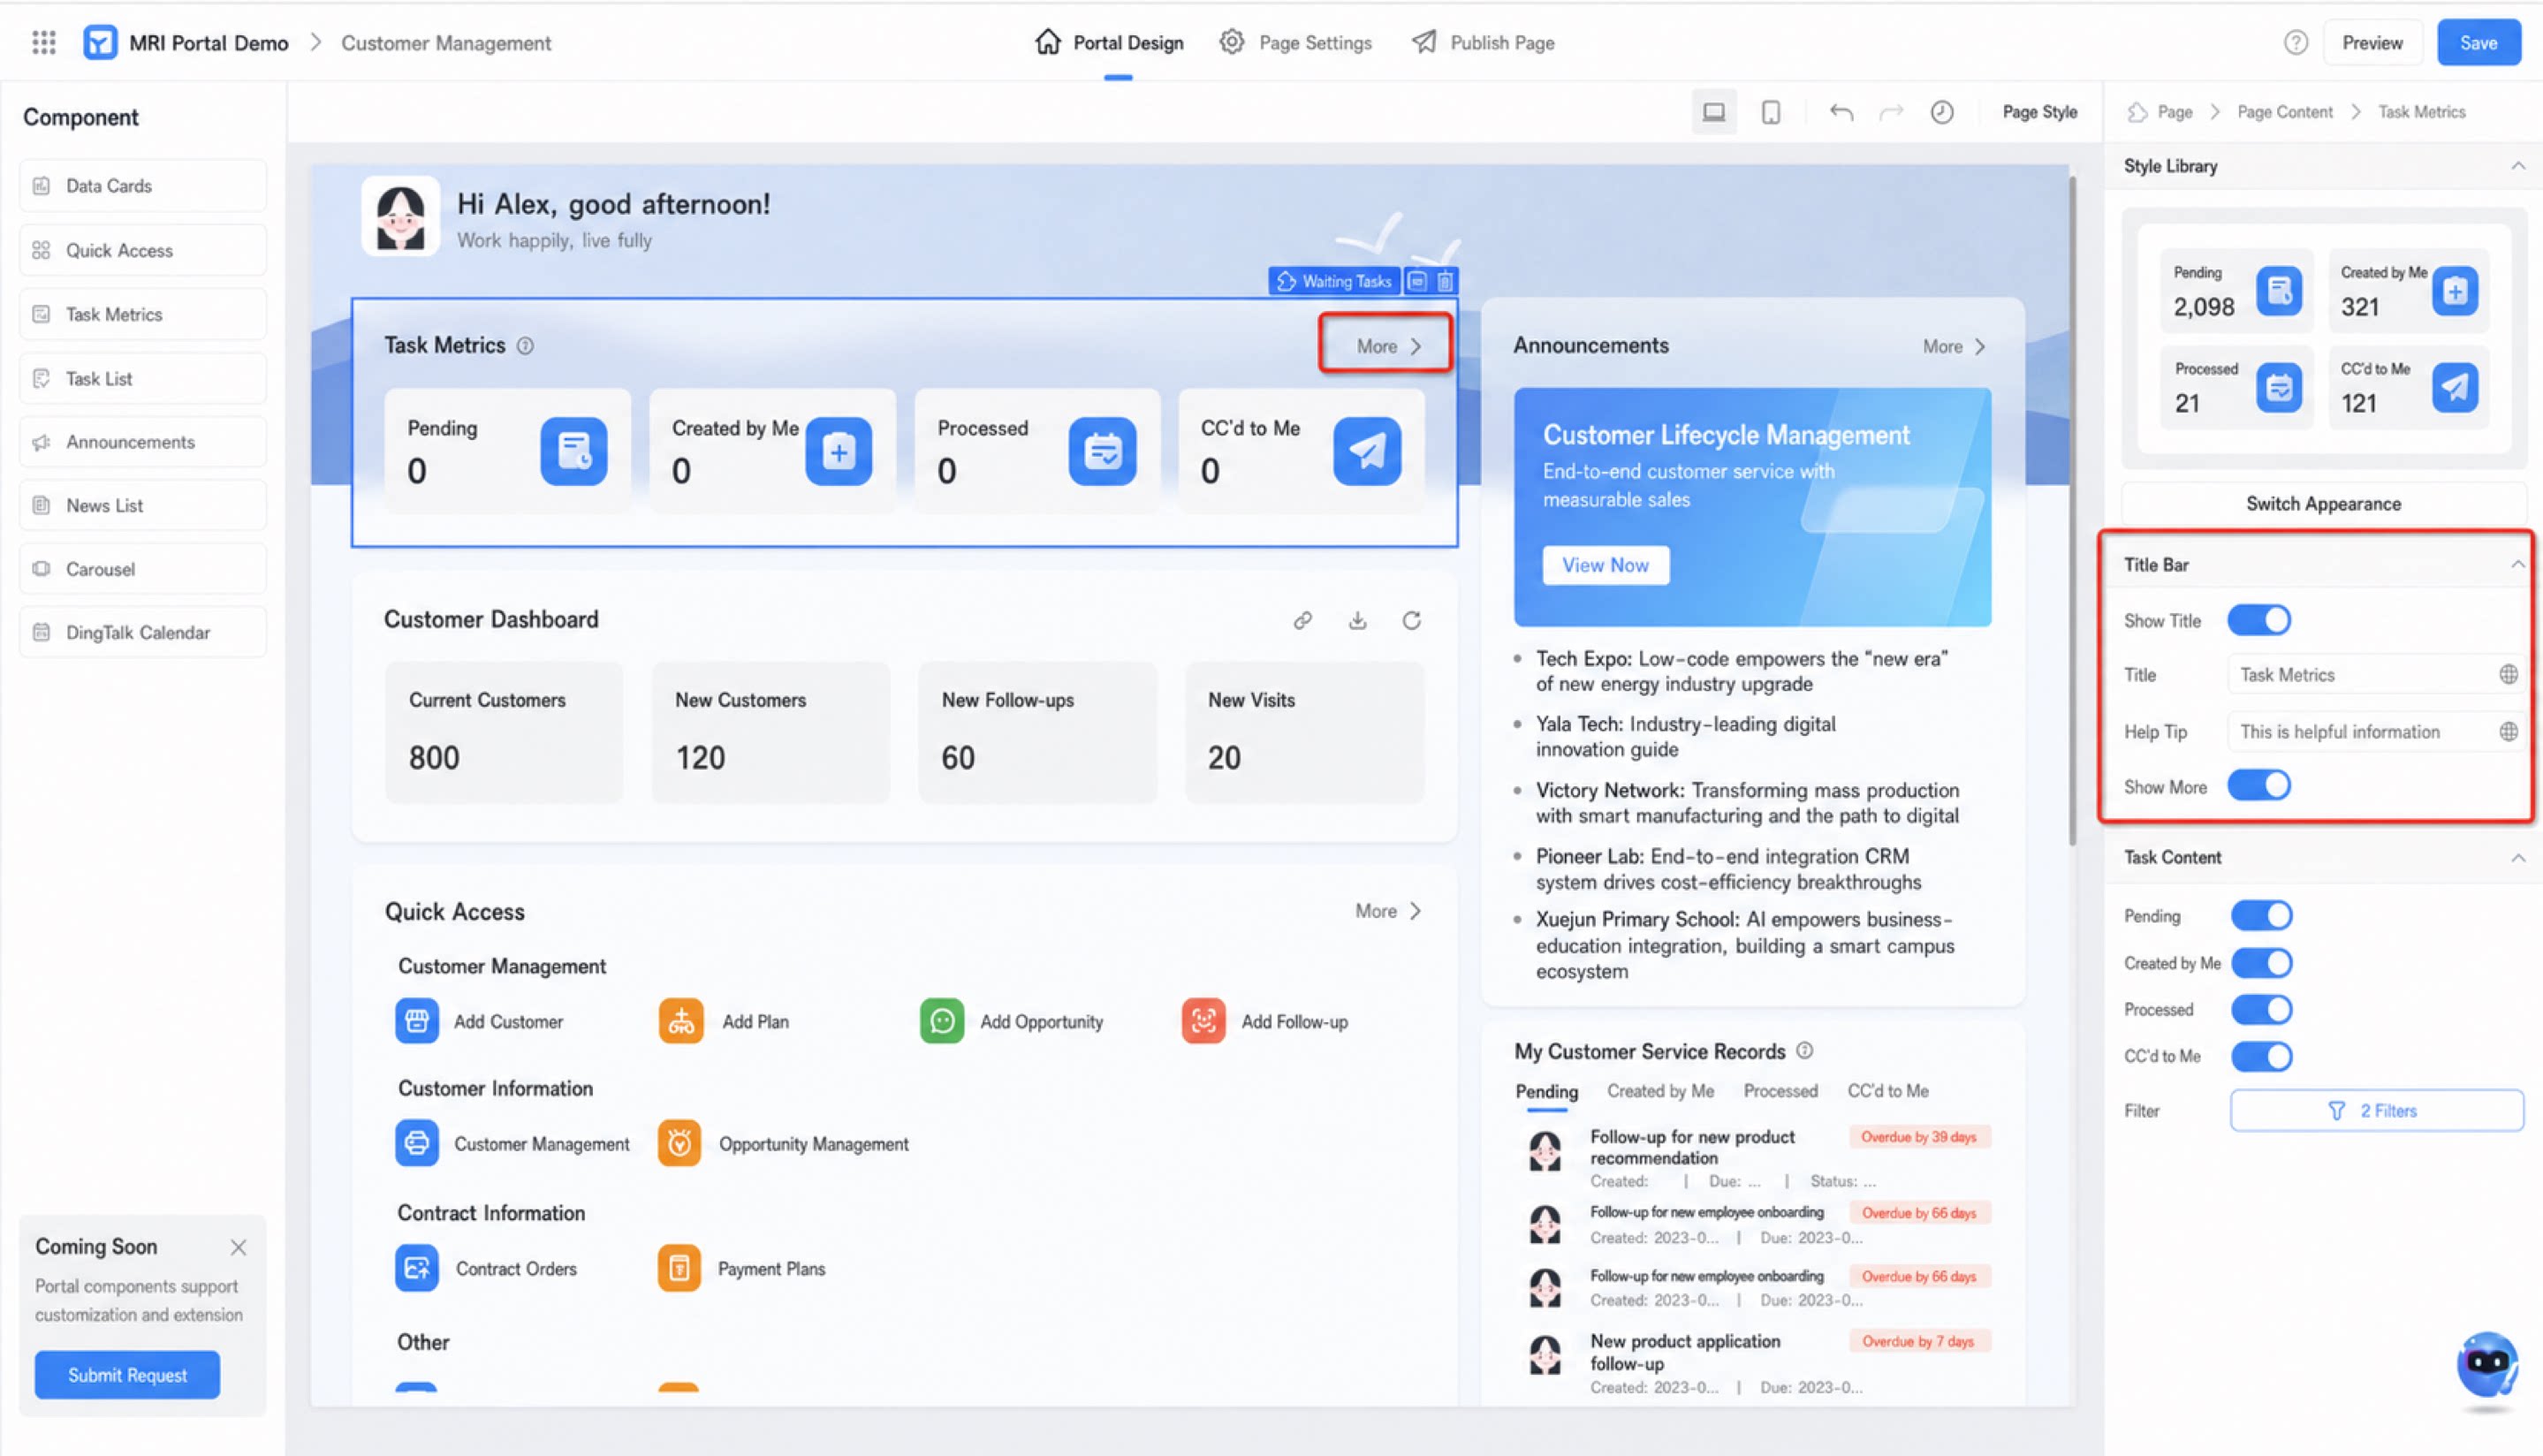
3.3 Configure Content
By default, the To-Do metrics data source reads filtered data from each category in the YiDA Task Center. You can also configure the following attributes:- Control whether each task status (Pending My Action, Created by Me, Processed by Me, CC to Me) is displayed.
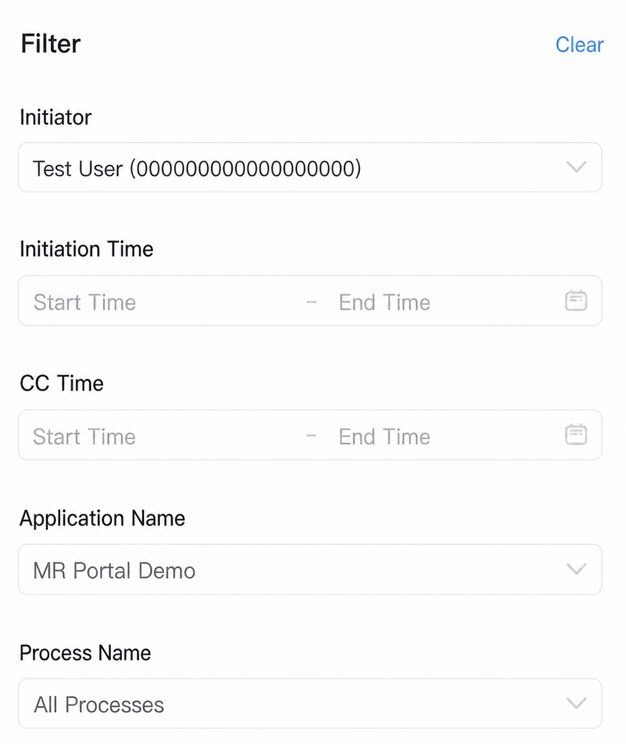
- Filter To-Do data by Initiator, Initiation Time, CC Time, App Name, or Process Name.