

 Chats
Chats Calendar
 Meetings
 Contacts
 Mail
Mail Docs
Docs Drive
Drive AI Table
 AI Minutes
 Attendance
 Approval
 YiDA
YiDA Admin Console
1. Overview
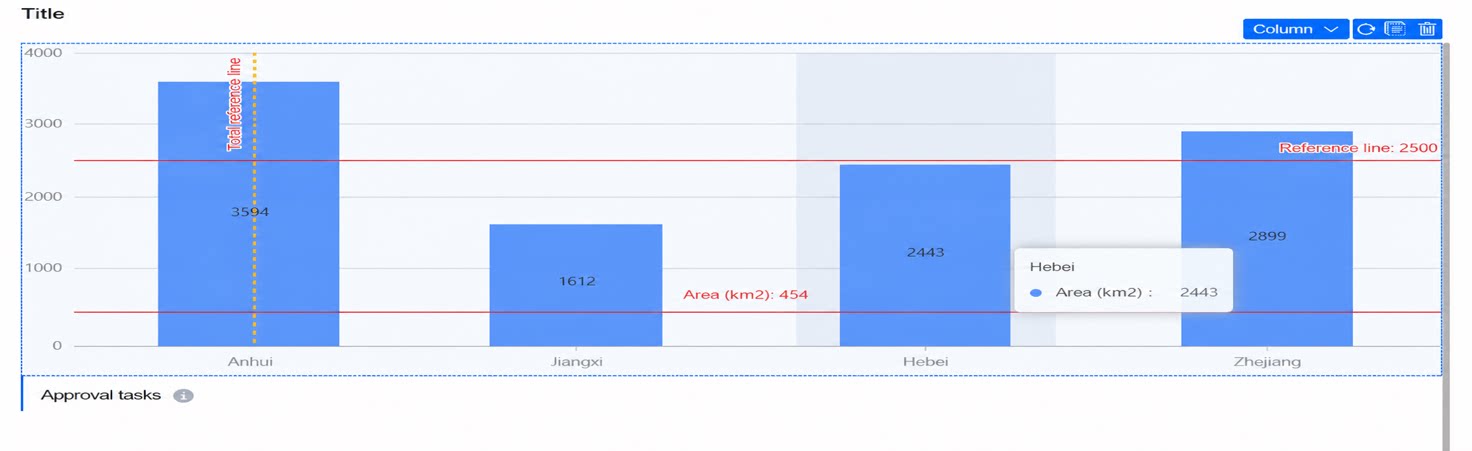
Configure chart reference lines, with support for multiple lines at the same time. Supported charts: Column, Line, Column-Line combo, and Scatter.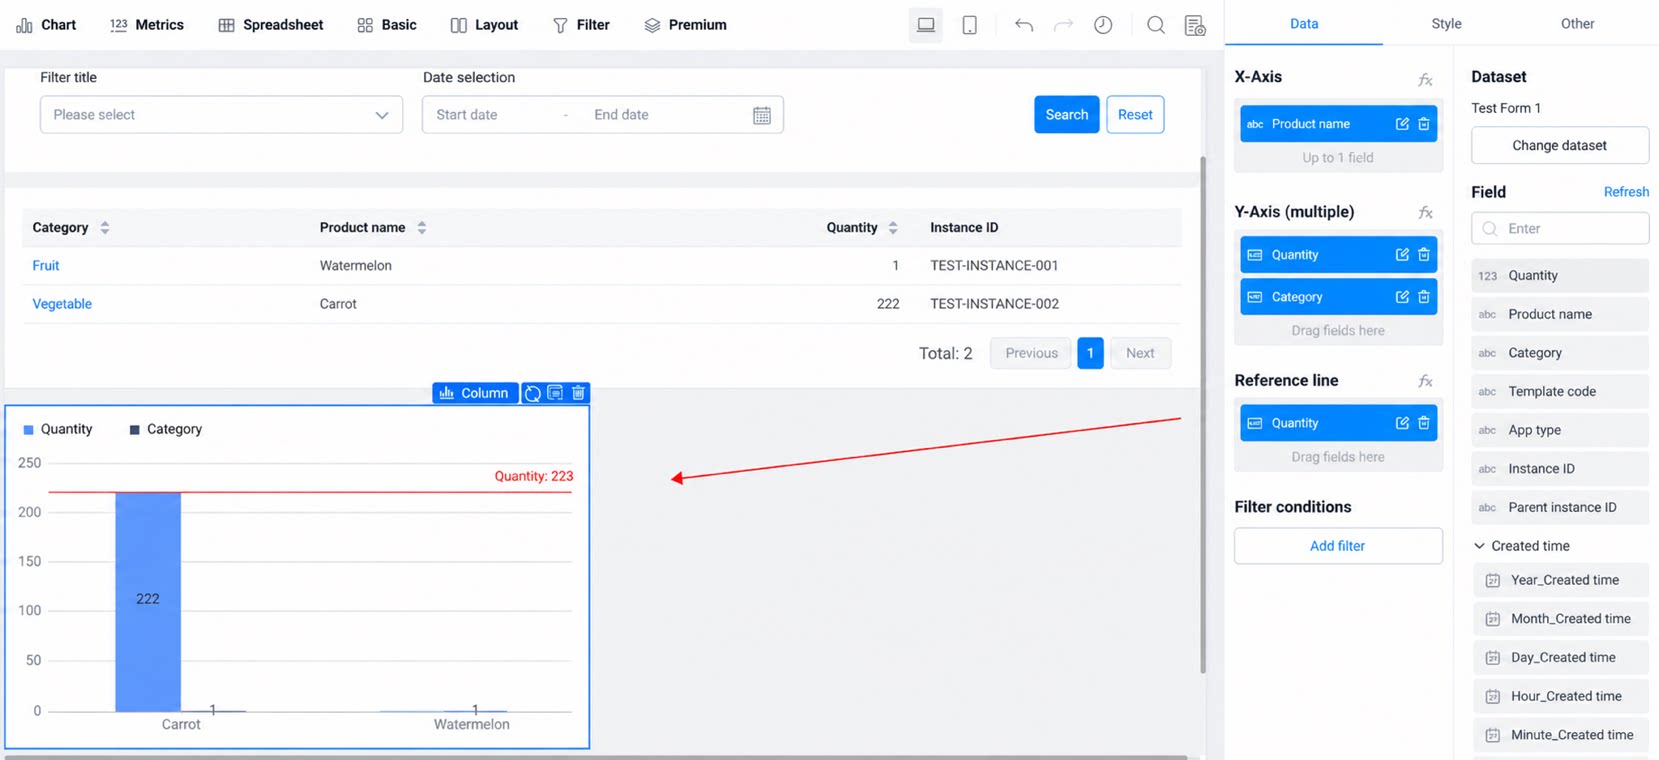
2. Reference Line — Data Settings Panel
2.1 Aggregation
For the reference line value, you can use a regular field with aggregation, or add a formula field directly.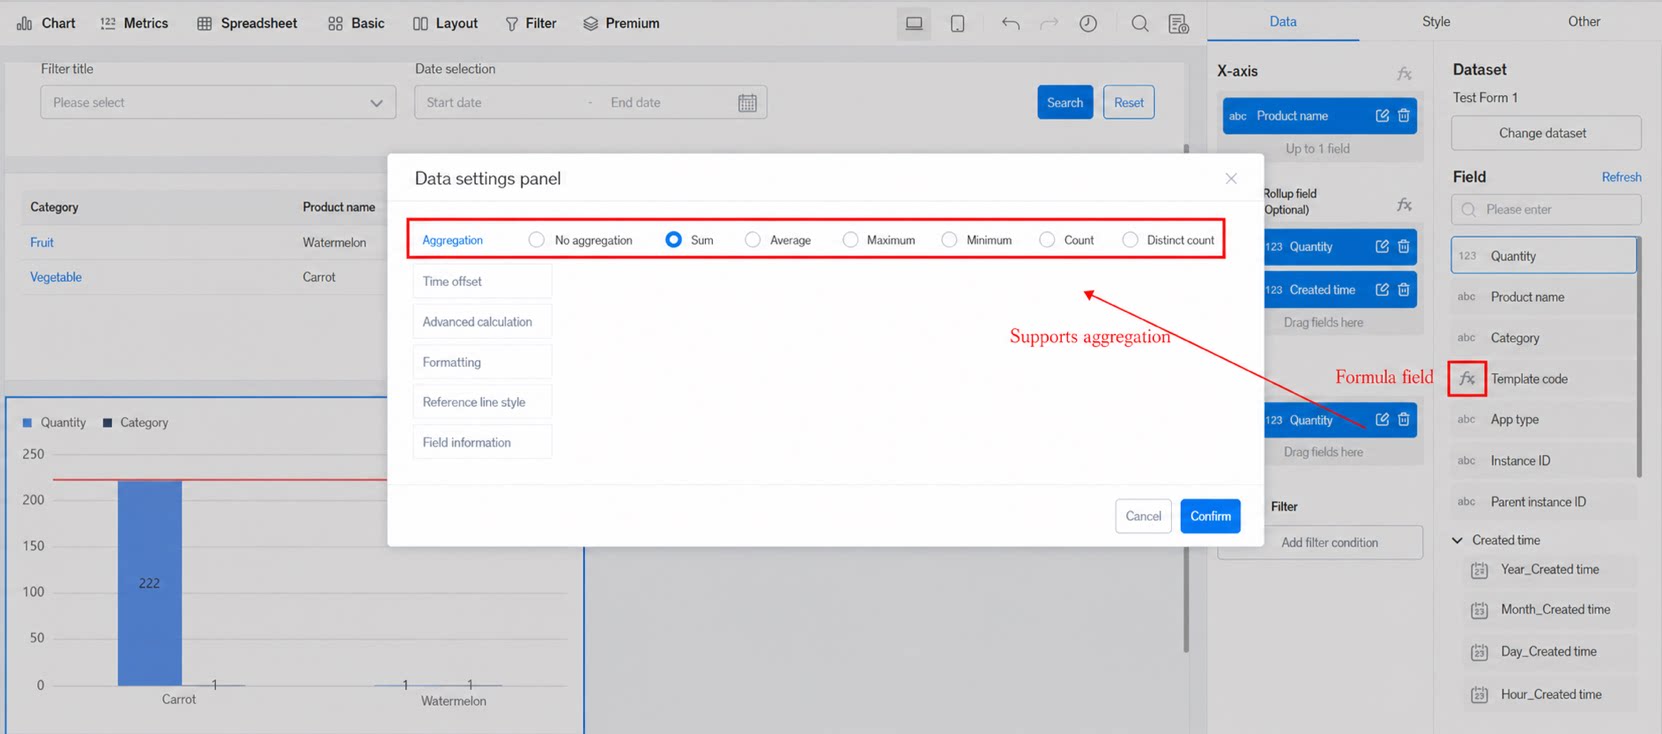
2.2 Reference Line Style
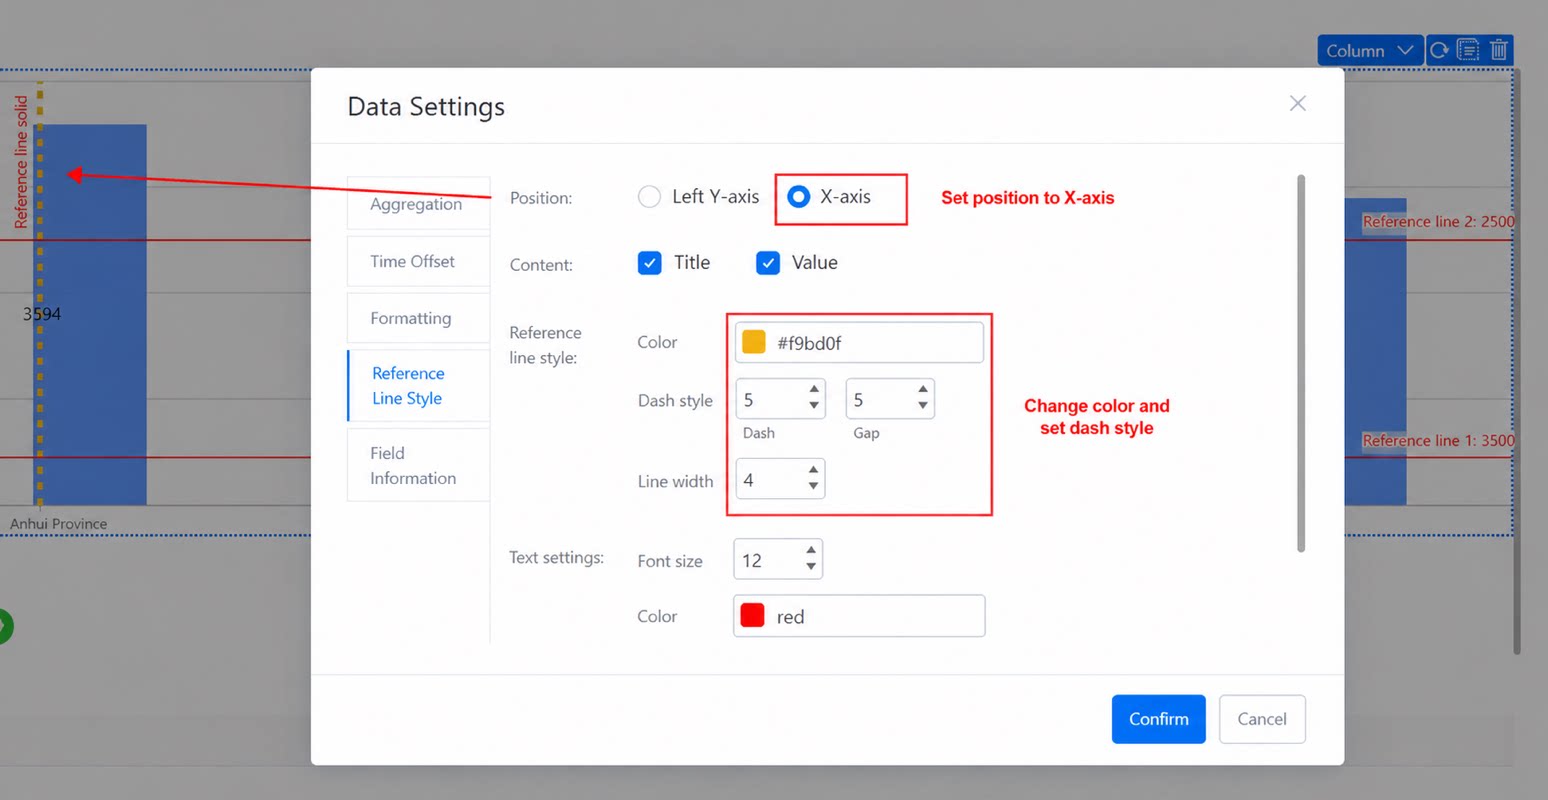
- Location: choose between the left Y-axis value or the X-axis.
- Content: title and value, selected by default.
- Reference line style: change the color, configure a dashed style, and set the line width.
- Text settings: set the font size, color, and display position.
3. Examples
3.1 Example 1: Place the Reference Line on the X-Axis and Display It as a Dashed Line
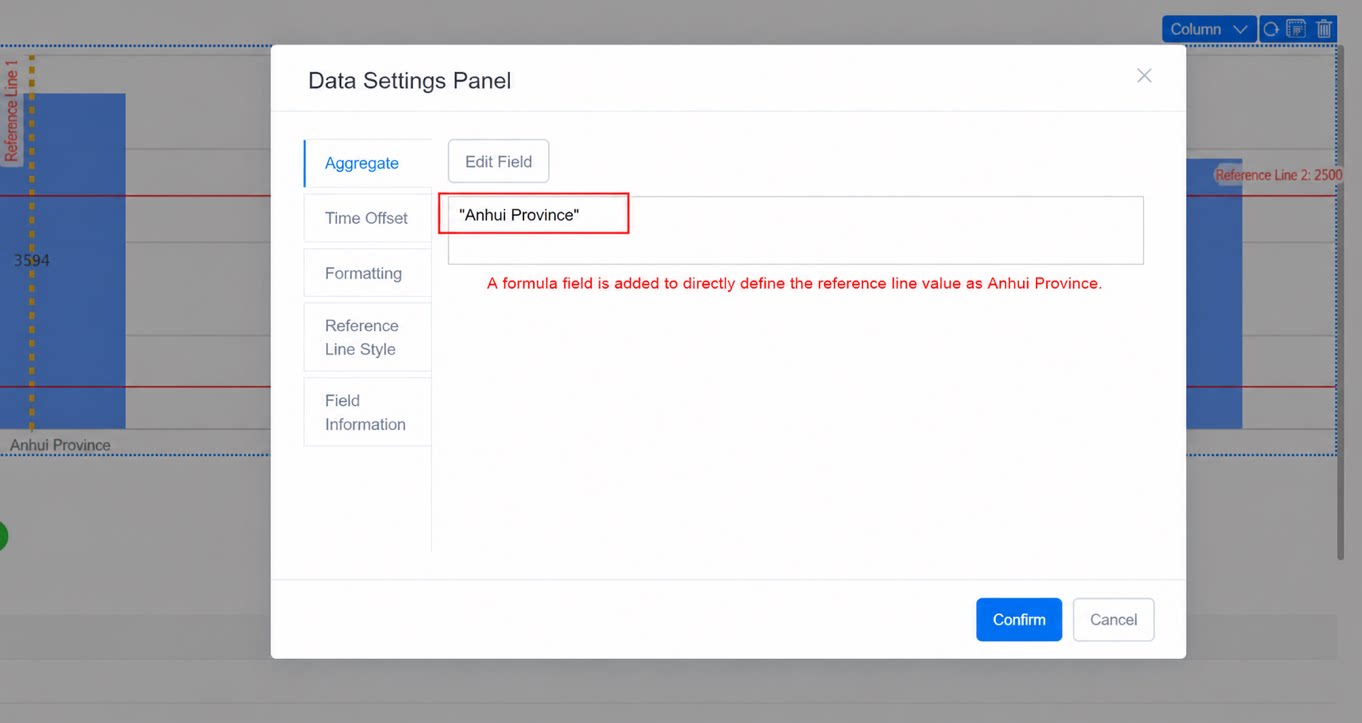
- When setting the reference line value, make sure it corresponds to X-axis content.
- Set the reference line location to the X-axis, then configure the color and dashed style.
3.2 Example 2: Place the Reference Line on the Right Y-Axis
- Configure the reference line value. Here, a formula field is used as an example:
- Set the reference line location to the right Y-axis: