Add a funnel chart
In the upper-left, click Add chart. Pick Funnel chart.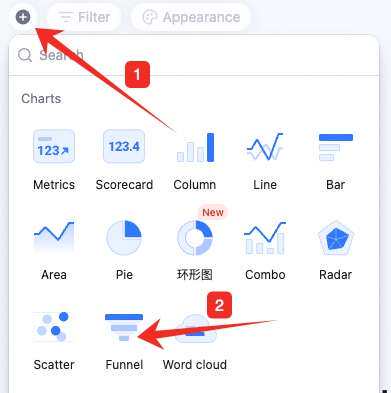
Configure the funnel chart
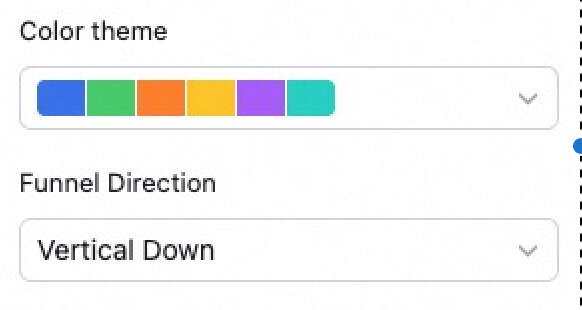
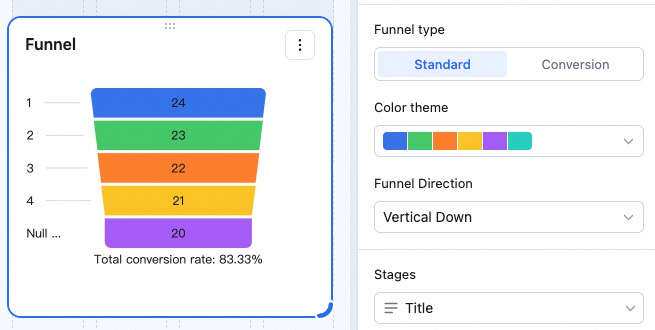
Configure type/data and custom style: Data: pick source — table and data range. All data enables filters.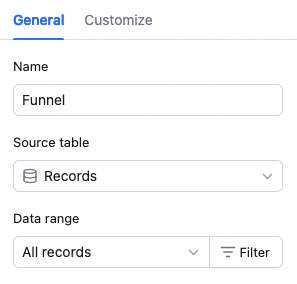 Chart: pick a color theme.
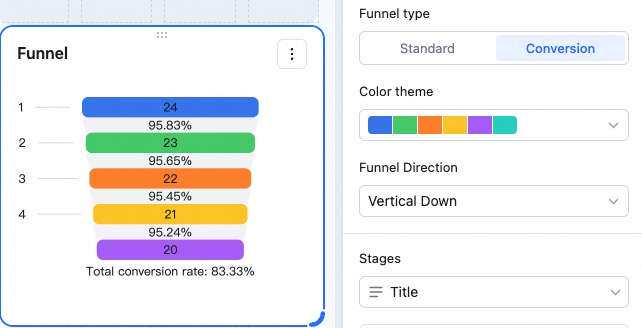
 Funnel type: regular funnel or conversion funnel. Regular funnel doesn’t compute conversion or overall conversion.
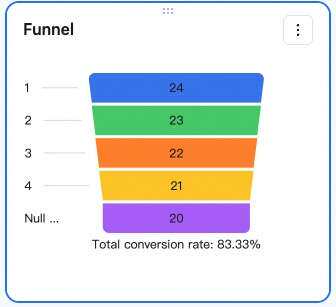 Conversion rate: ratio of one stage to the prior stage. Example: in the chart above, the bottom stage is 3 and the top stage is 10 — the end-to-end conversion is 3/10 ≈ 30.00%.
Toggle roll up current and lower stages. When on, each stage aggregates its own data plus all lower stages. When off, each stage shows only its own data.
Conversion rate: ratio of one stage to the prior stage. Example: in the chart above, the bottom stage is 3 and the top stage is 10 — the end-to-end conversion is 3/10 ≈ 30.00%.
Toggle roll up current and lower stages. When on, each stage aggregates its own data plus all lower stages. When off, each stage shows only its own data.
 Funnel stages: the stages shown in the chart. In an AI Table dashboard, funnel stages are generated from the selected field’s values — each stage shows that value and its data.
Custom style: background color.
Funnel stages: the stages shown in the chart. In an AI Table dashboard, funnel stages are generated from the selected field’s values — each stage shows that value and its data.
Custom style: background color.
View funnel chart data
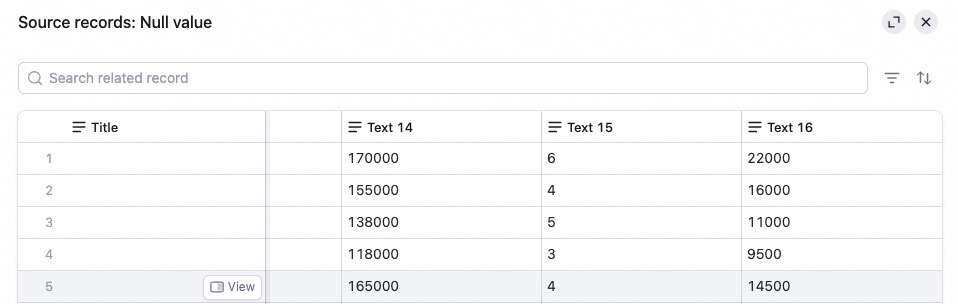
Anyone with read access can browse the funnel data. Hover over a stage — the count/value and conversion rate appear.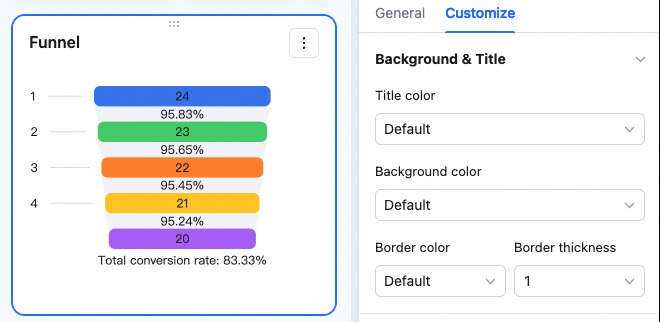 Click a stage — open Data details to see the records behind it.
Manage the funnel chart
Hover over the chart — find the icon in the upper-right. Click for: configure, rename, copy, add to dashboard center, copy as image, export as image, delete.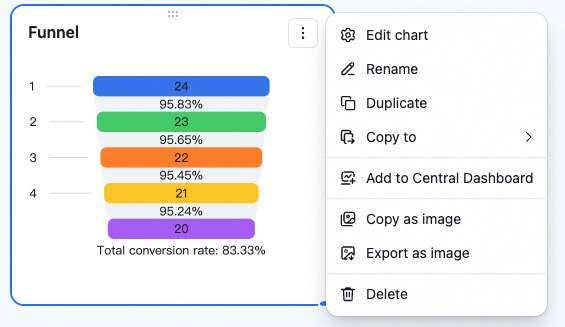 Drag the lower-right corner to resize. Drag the top to reposition.