Add a progress chart to a dashboard to visualize task or goal completion — clearly see the gap between current progress and the target. Common scenarios:
  1. Annual sales target: show the sales team’s percentage to target — managers see overall performance fast.
  2. Project milestones: show the status of key milestones (requirements review, dev complete, QA passed) — PMs monitor health and ensure on-time delivery.
  3. Personal KPIs: show employees’ quarterly/annual KPI progress (customer follow-ups, code commits, etc.) — clear basis for reviews and self-management.

Add a progress chart

In the upper-left, click Add chart. Pick Progress chart.

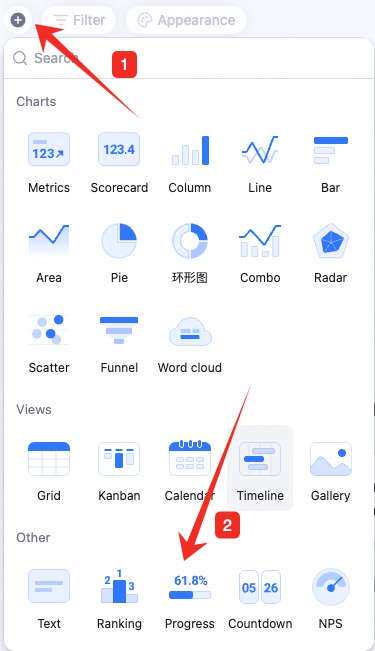
Configure the progress chart

In the config panel, set type, shape, target, current value, number format, and custom style. Type: numeric or date. A numeric progress chart targets a specific number — the chart shows target, current, and percentage. A date progress chart shows the progress of a date range, e.g., the percentage of the month elapsed. 
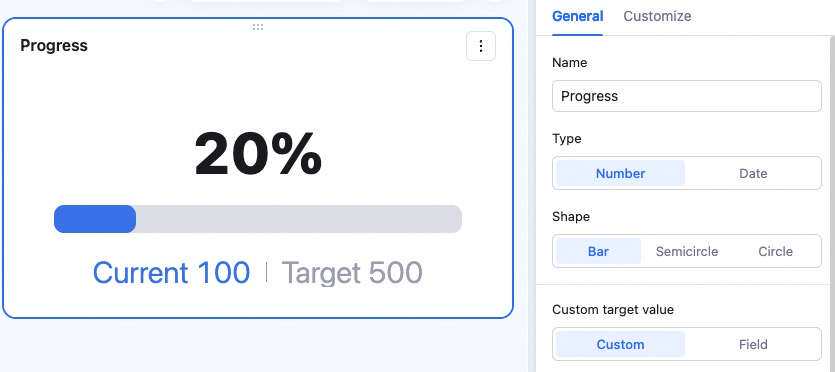
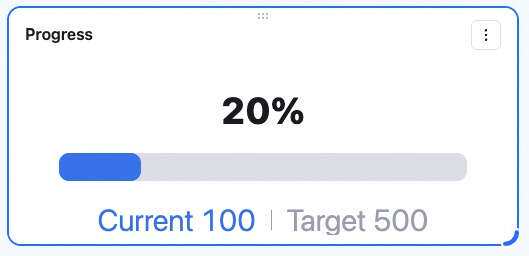
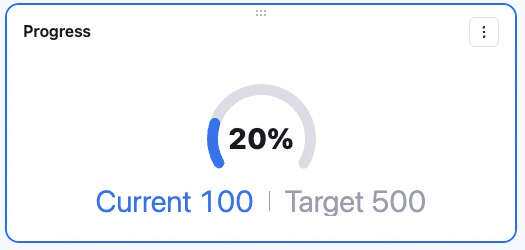
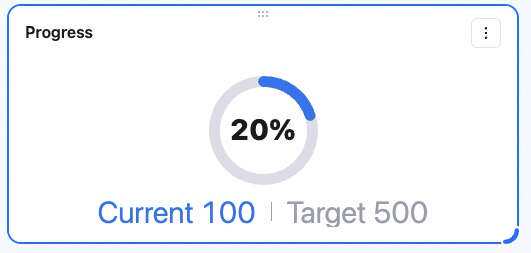
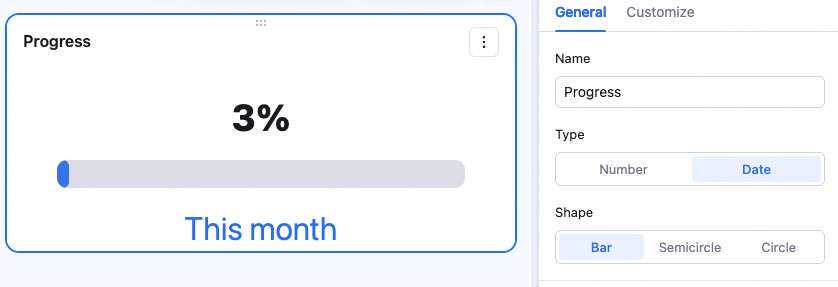
Shape: bar, semi-ring, or ring — examples below.

Numeric progress chart

Target: custom value or pick a field. With custom value, enter the target directly — optionally add a description like “Sales”, which replaces the “Target” label in the chart. With a field, pick a table and data range — use the record count or aggregated value of a field as the target. Description is also supported. Current value: same options — custom value or field. With custom value, enter directly and optionally add a description like “Current hours” — the “Current” label changes accordingly. With a field, pick a table and data range — use the record count or aggregated value as the current value. Description is also supported. Number format: configure percentage format, decimals for current/target, abbreviation, unit, and unit position. Percentage format: enter a number to set decimal places — e.g., enter 3 to display 41.408%. Decimals: enter a number to set decimal places for current/target — e.g., enter 2 and total hours show as 483.00. Abbreviation: optionally abbreviate large numbers — pick a unit (thousand, ten-thousand, million, hundred-million). Current and target display in the new unit. Unit: optionally add a unit to current/target — for currency, pick CNY, USD, or enter a custom unit. Unit position: place the unit on the left or right of the value. Custom style: adjust background color, percentage color, current/target color, and progress bar color.

Date progress chart

Show the progress of the current date within a date range — e.g., for a date range of the current month, the chart shows the elapsed days from the 1st to today as a percentage of the total days. Date range: pick a range — current month, current quarter, current year, or custom. For custom, pick start and end dates of the target period. Current date: dropdown — today, yesterday, or custom. For custom current date, pick a specific date. Date format: when date range or current date is custom, the date format is configurable.

Manage the progress chart

Hover over the chart — find the icon in the upper-right. Click for: configure, rename, copy, add to dashboard center, copy as image, export as image, delete. Drag the lower-right corner to resize. Drag the top to reposition.