NPS (Net Promoter Score) measures customer loyalty and word-of-mouth — based on the question ‘How likely are you to recommend us to a friend or colleague?’
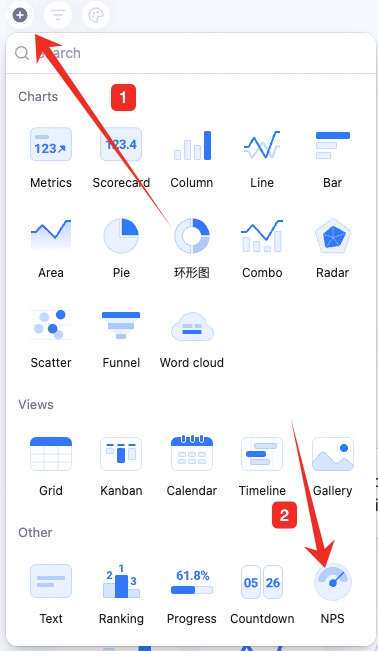
NPS (Net Promoter Score) is a key metric for customer loyalty and word-of-mouth — based on the question “How likely are you to recommend our company/product/service to a friend or colleague?”The NPS chart visualizes the metric — see the distribution of customer satisfaction at a glance. It builds primarily from a rating field, helping you quickly assess your brand image and pinpoint areas to improve — driving CX optimization and competitiveness.
Configure name, data, color, NPS settings, and style.Name: click the chart’s upper-left to rename.Data: set the source table and data range.Chart: change the NPS color theme. Each theme has three colors — Detractor, Passive, Promoter.NPS settings: pick a rating-type field as the NPS basis. Toggle data labels and detail visibility.Style: change the chart background color.
Hover over the chart — find the icon in the upper-right. Click for: configure, rename, copy, add to dashboard center, copy as image, export as image, delete.Drag the lower-right corner to resize. Drag the top to reposition.