Add a word cloud
In the dashboard top toolbar, click Add chart. In the chart type menu, pick Word cloud.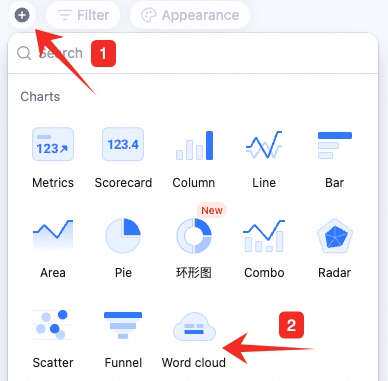
Configure the word cloud
Set data and custom style: Data: pick the source — table and data range. Selecting All data enables filters. Keyword field: pick the keyword field, words to hide, and whether to auto-tokenize. Custom style: change chart colors.
Manage the word cloud
Hover over the chart — find the icon in the upper-right. Click for: configure, rename, copy, add to dashboard center, copy as image, export as image, delete.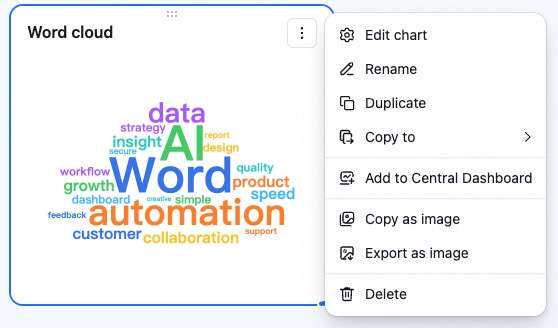 Drag the lower-right corner to resize. Drag the top to reposition.