- Employee competency review: show communication, technical skills, teamwork, and innovation in a radar chart — managers see strengths and improvement areas at a glance.
- Product performance analysis: lay out product metrics (battery life, speed, stability, etc.) on a radar chart — compare strengths/weaknesses across products.
- Market competitiveness: compare market share, brand awareness, customer satisfaction, R&D investment, etc. — back strategic decisions with data.
Add a radar chart
In the upper-left, click Add chart. Pick Radar chart.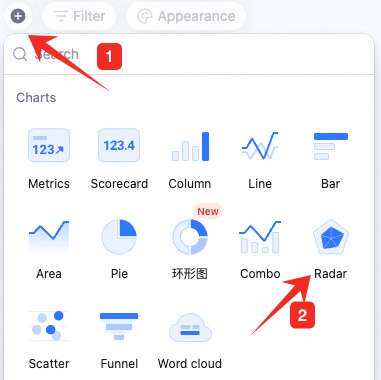
Configure the radar chart
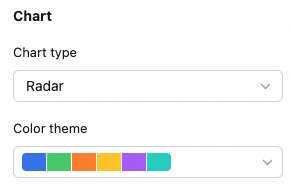
Configure type/data and custom style: Data: pick source — table and data range. All data enables filters. Picking a specific view inherits the view’s filter config.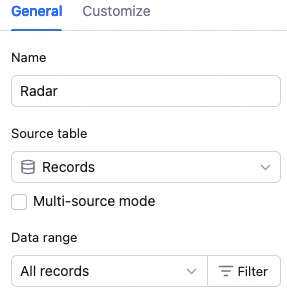 Chart: switch chart type, pick a color theme.
 Category axis: pick the category field, sort basis (by category value or record order), and order.
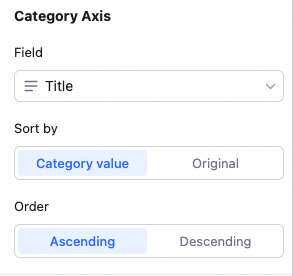 Sort basis details:
Category value: sort by the category field type — numeric, alphabetical, single/multi-select option order, etc.
Record order: sort by record order in the source view.
Value axis (series): aggregation (count of records or aggregated field value), value content, and group aggregation.
With “count of records”: only set group aggregation (none or by field).
With “aggregated field value”: no grouping → multiple value fields, each with its own aggregation (count, sum, average, max, etc.). Remove/move up/down per value. Grouping → one value field with one aggregation.
Sort basis details:
Category value: sort by the category field type — numeric, alphabetical, single/multi-select option order, etc.
Record order: sort by record order in the source view.
Value axis (series): aggregation (count of records or aggregated field value), value content, and group aggregation.
With “count of records”: only set group aggregation (none or by field).
With “aggregated field value”: no grouping → multiple value fields, each with its own aggregation (count, sum, average, max, etc.). Remove/move up/down per value. Grouping → one value field with one aggregation.
 Note: sum, max, min, average only apply to numeric fields.
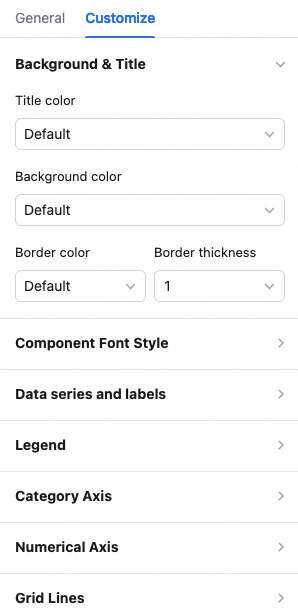
Custom style: background color, radar shape (polygon/circle), color fill on/off, legend position, value display, overlap settings, axis visibility, axis baselines, axis-tick labels — all configurable.
Note: sum, max, min, average only apply to numeric fields.
Custom style: background color, radar shape (polygon/circle), color fill on/off, legend position, value display, overlap settings, axis visibility, axis baselines, axis-tick labels — all configurable.
Manage the radar chart
Hover over the chart — find the icon in the upper-right. Click for: configure, rename, copy, add to dashboard center, copy as image, export as image, delete.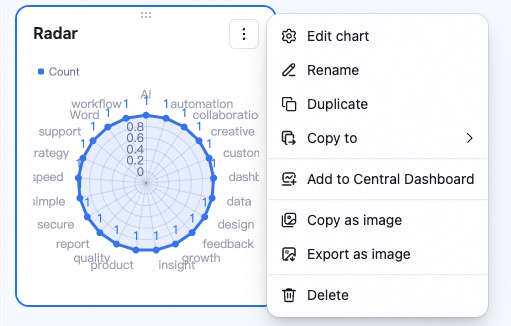 Drag the lower-right corner to resize. Drag the top to reposition.