Add a metric card
In the upper-left, click Add chart. Pick Metric card.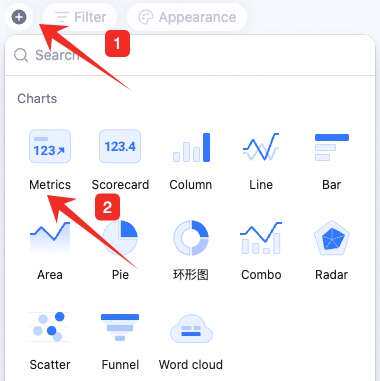
Configure the metric card
In the config panel, set data source, metric card settings, and custom style — and configure YoY/MoM comparisons and trend lines. Data: pick source — table and data range. All data enables filters.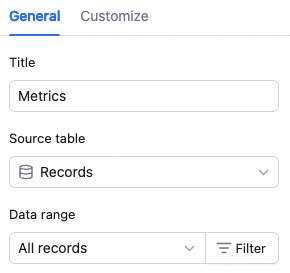 Metric card settings: configure the title and aggregation method (count of records or aggregated field value). Aggregated field value is available only if the source table has a numeric field, a formula field returning a number, or a lookup field referencing a numeric field. With aggregated field value, in Pick field, select the field and aggregation — sum, max, min, or average.
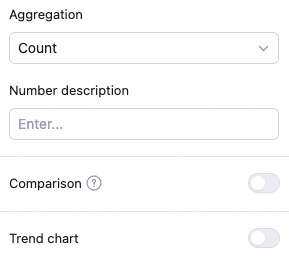
 Custom style: adjust background color, title color, metric color, number format, and YoY/MoM style. Number formats: number, percent, CNY, USD — with configurable decimals and large-number abbreviation.

YoY/MoM and trend line features
YoY/MoM configuration YoY/MoM: off by default. Toggle on to configure date basis, time range, comparison dimension, period/cumulative, and calculation type (difference rate / difference / raw value). Date basis: select a date field or a formula field returning a date. Time range: today, yesterday, this week, last week, this month, last month, this quarter, this year, last year, last 7 days, last 14 days, last 30 days, last 3 months, last 6 months, last 365 days. Comparison dimension: YoY or MoM. Period vs cumulative: “Period” compares the same elapsed unit time in both periods; “Cumulative” compares the elapsed unit time in the current period to the entire prior period. Example: comparing this month to last month — period compares 3.1–3.19 to 2.1–2.19; cumulative compares 3.1–3.19 to 2.1–2.28. Use period to compare cycles to date; use cumulative to monitor progress against the prior cycle as a baseline. Calculation type: difference, difference rate, or raw value. Difference: current data − period (cumulative) data Difference rate: (current data − period (cumulative) data) / period (cumulative) data × 100% Raw value: period (cumulative) data Trend line configuration Trend line: off by default. Toggle on to pick a date basis and time range. Date basis is a date field; time range is the trend window. Once configured, the trend line appears as a small line chart inside the metric card. Date basis: a date field in the source table. Time range: today, yesterday, this week, last week, this month, last month, this quarter, this year, last year, last 7 days, last 14 days, last 30 days, last 3 months, last 6 months, last 365 days. Note: the selected time range must contain at least 2 data points to render a trend line.📌 YoY vs MoMYear-over-Year (YoY) YoY compares to the same statistical period in history — observe long-term trends and growth. Default basis is annual. Formulas: • YoY difference rate = (current − same-period prior) ÷ same-period prior × 100% • YoY difference = current − same-period prior • Raw value = same-period prior Month-over-Month (MoM, also Period-over-Period) MoM compares to the previous adjacent period — observe period-over-period change. For example, comparing March 2025 to February 2025 is MoM. Formulas: • MoM difference rate = (current − previous period) ÷ previous period × 100% • MoM difference = current − previous period • Raw value = previous period YoY and MoM together give a fuller view of change and underlying business logic. YoY is for long-term growth assessment; MoM captures short-term volatility — combine them for stronger decision support.
Manage the metric card
Hover over the chart — find the icon in the upper-right. Click for: configure, rename, copy, add to dashboard center, copy as image, export as image, delete.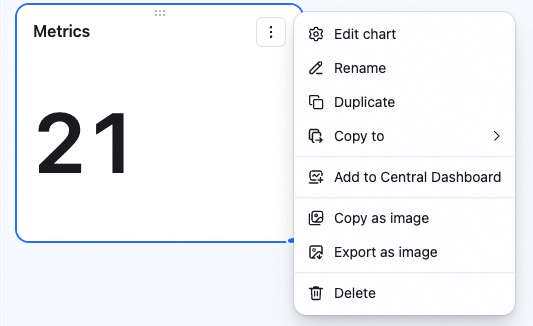 Drag the lower-right corner to resize. Drag the top to reposition.