- Reports & retrospectives: state conclusions, data shifts, or anomalies inline — no page switching during a presentation.
- Context: explain chart purpose, metric definitions, and other background — helps teammates ramp up faster.
Add a text widget
In the upper-left of the dashboard, click Add chart. In the chart type menu, pick Text.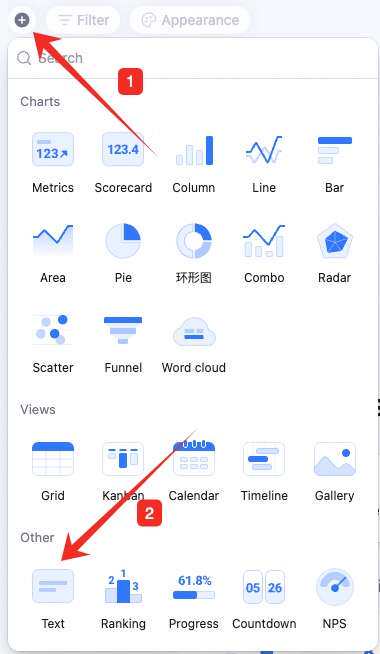
Configure the text widget
Type text in the widget. Select text to format — heading level, alignment, font size, etc.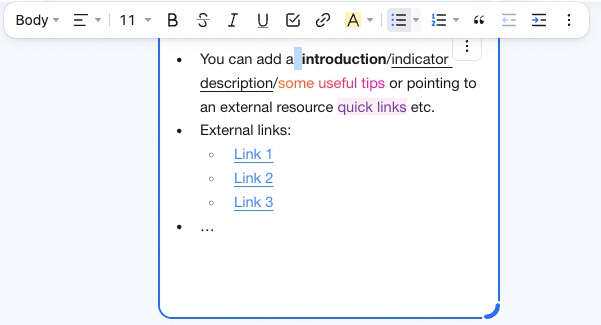 Open, edit, or copy links inside the text widget.

Manage the text widget
Hover over the widget — find the icon in the upper-right. Click it for: configure, rename, copy, copy as image, export as image, delete.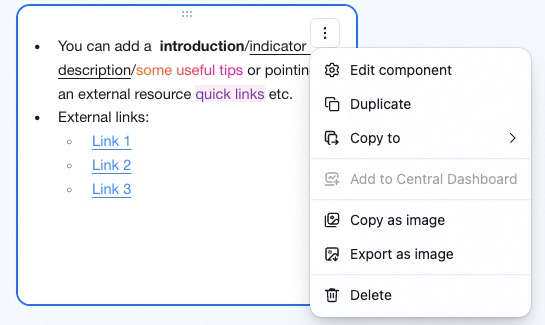 Drag the lower-right corner of the widget to resize. Drag the top to reposition.