Add a ranking
In the dashboard top toolbar, click Add chart. In the type menu, pick Ranking.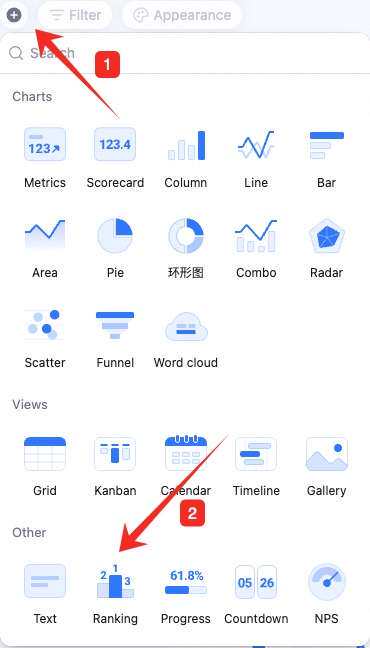
Configure the ranking
Configure type/data and custom style: Data: pick source — table and data range. All data enables filters. Picking a single view skips filters and uses the view’s existing setup.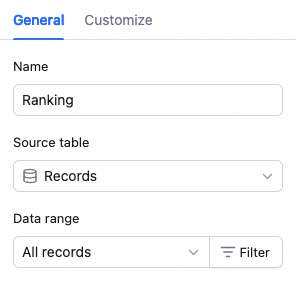 Ranking settings: ranking field, basis, sort order, count.
- Ranking field: pick a specific table field.
- Basis: pick a field and one of count, distinct count, sum, average, max, min. Sum/average/max/min only on numeric fields.
- Sort order: ascending (default) or descending.
- Count: how many records to show — up to 100.
 Custom style: background color, legend, axes, and more.
Manage the ranking
Hover over the chart — find the icon in the upper-right. Click for: configure, rename, copy, add to dashboard center, copy as image, export as image, delete.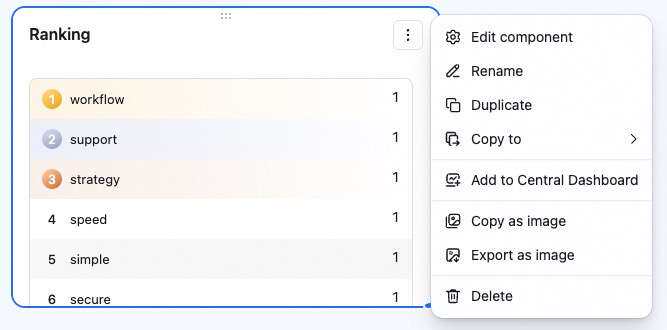 Drag the lower-right corner to resize. Drag the top to reposition.