Add a grid view widget
In the upper-left, click Add chart. Pick Grid view.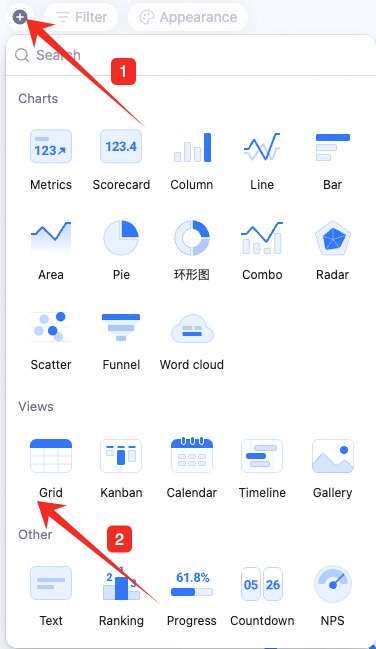
Configure the grid view widget
Configure type/data and custom style: Data: pick source — table and data range. All data enables filters.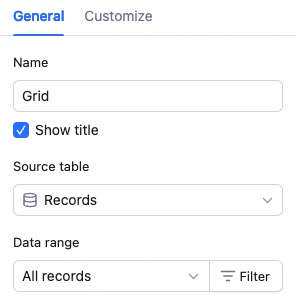 Grid config: groups, sorting, row height, fields shown and order.
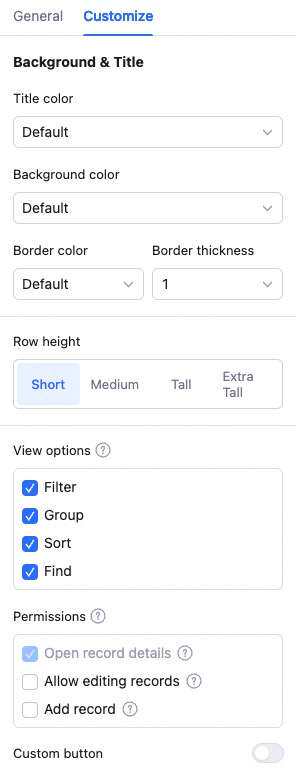
 Custom style: background color.
Manage the grid view widget
Hover over the widget — find the icon in the upper-right. Click for: configure, rename, copy, add to dashboard center, copy as image, export as image, delete.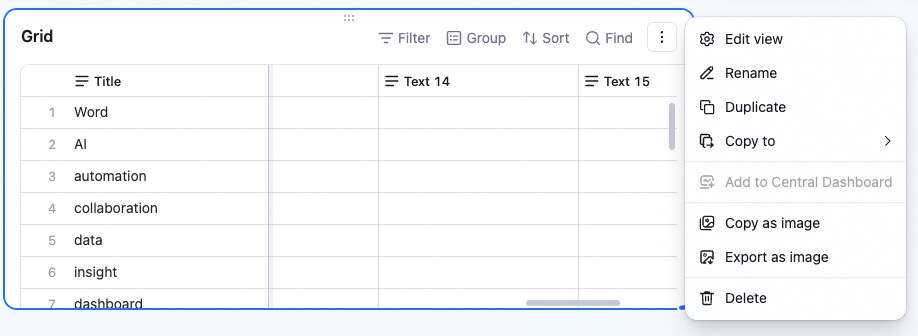 Drag the lower-right corner to resize. Drag the top to reposition.
Relationship to the original grid view
A grid view widget added to the dashboard relates to the original grid view as follows:- The widget is not editable.
- When you edit cells in the original grid view, the widget updates in sync. “Edit” = add/edit/delete record, add/edit/delete field.
- Their configs are independent. “Config” = filter, group, sort, row height, column width, field order, record order, etc.