

 Chats
Chats Calendar
 Meetings
 Contacts
 Mail
Mail Docs
Docs Drive
Drive AI Table
 AI Minutes
 Attendance
 Approval
 YiDA
YiDA Admin Console
1. Introduction
The calendar heatmap visualizes progress across time periods on a calendar and adjusts colors based on numerical values. It fits scenarios such as reviewing code volume or work activity over time.2. Instructions
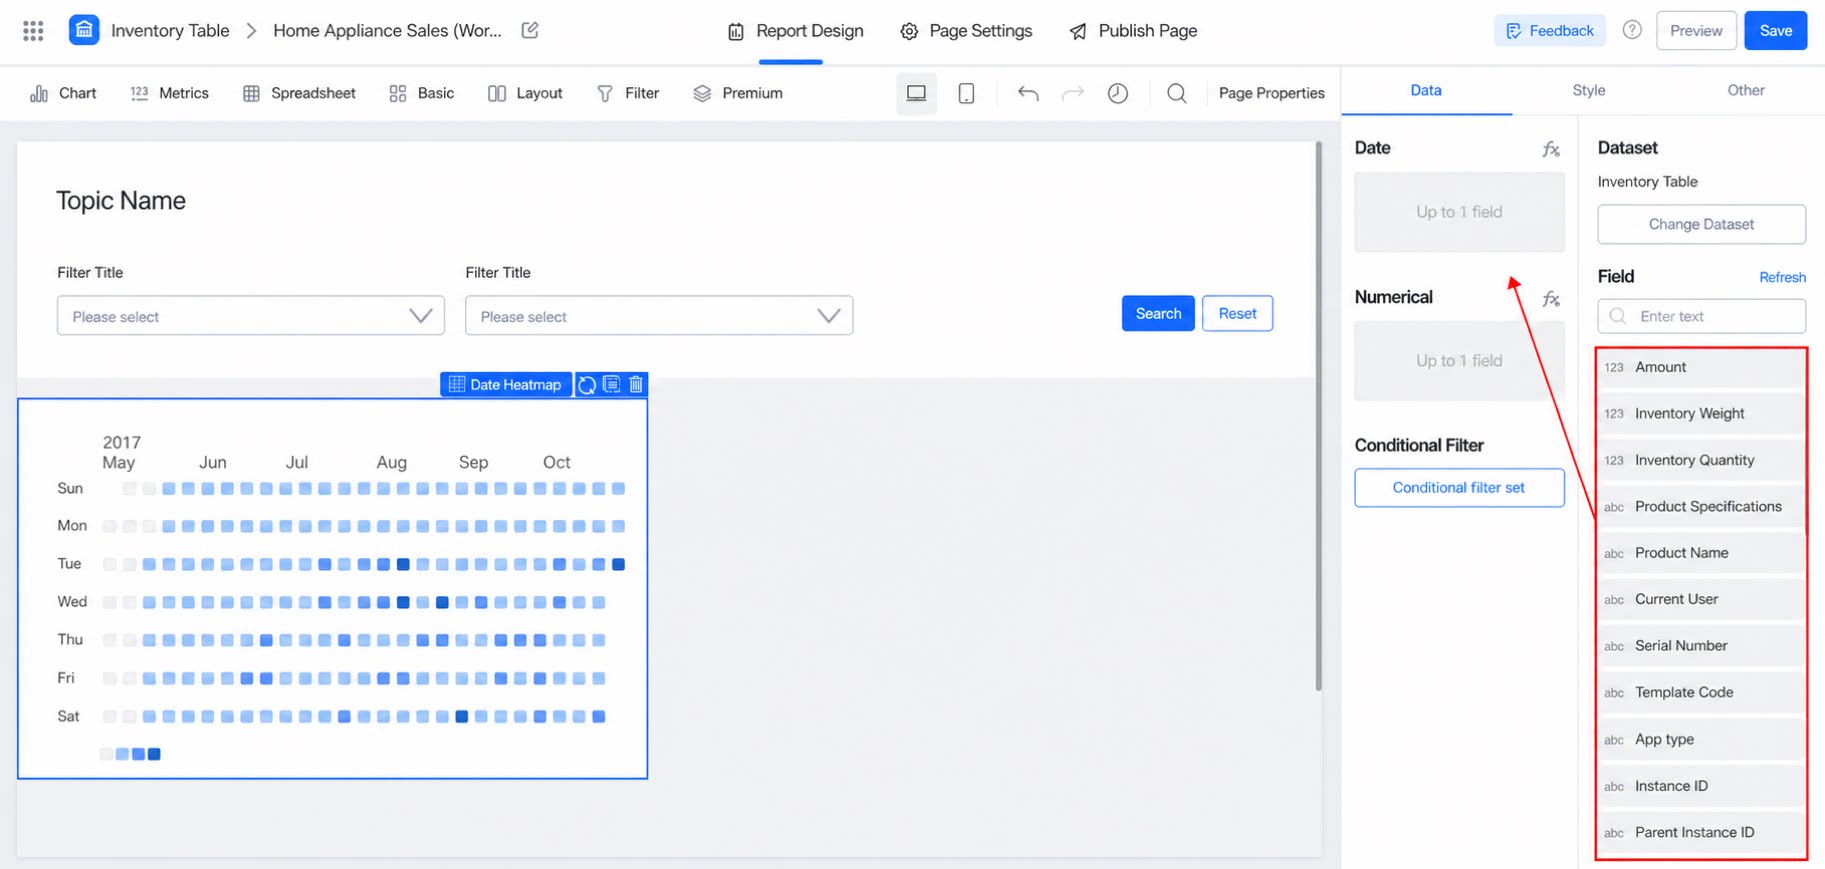
2.2 Select Fields
In the Date field, make sure to select a Time Field. Otherwise, rendering will fail.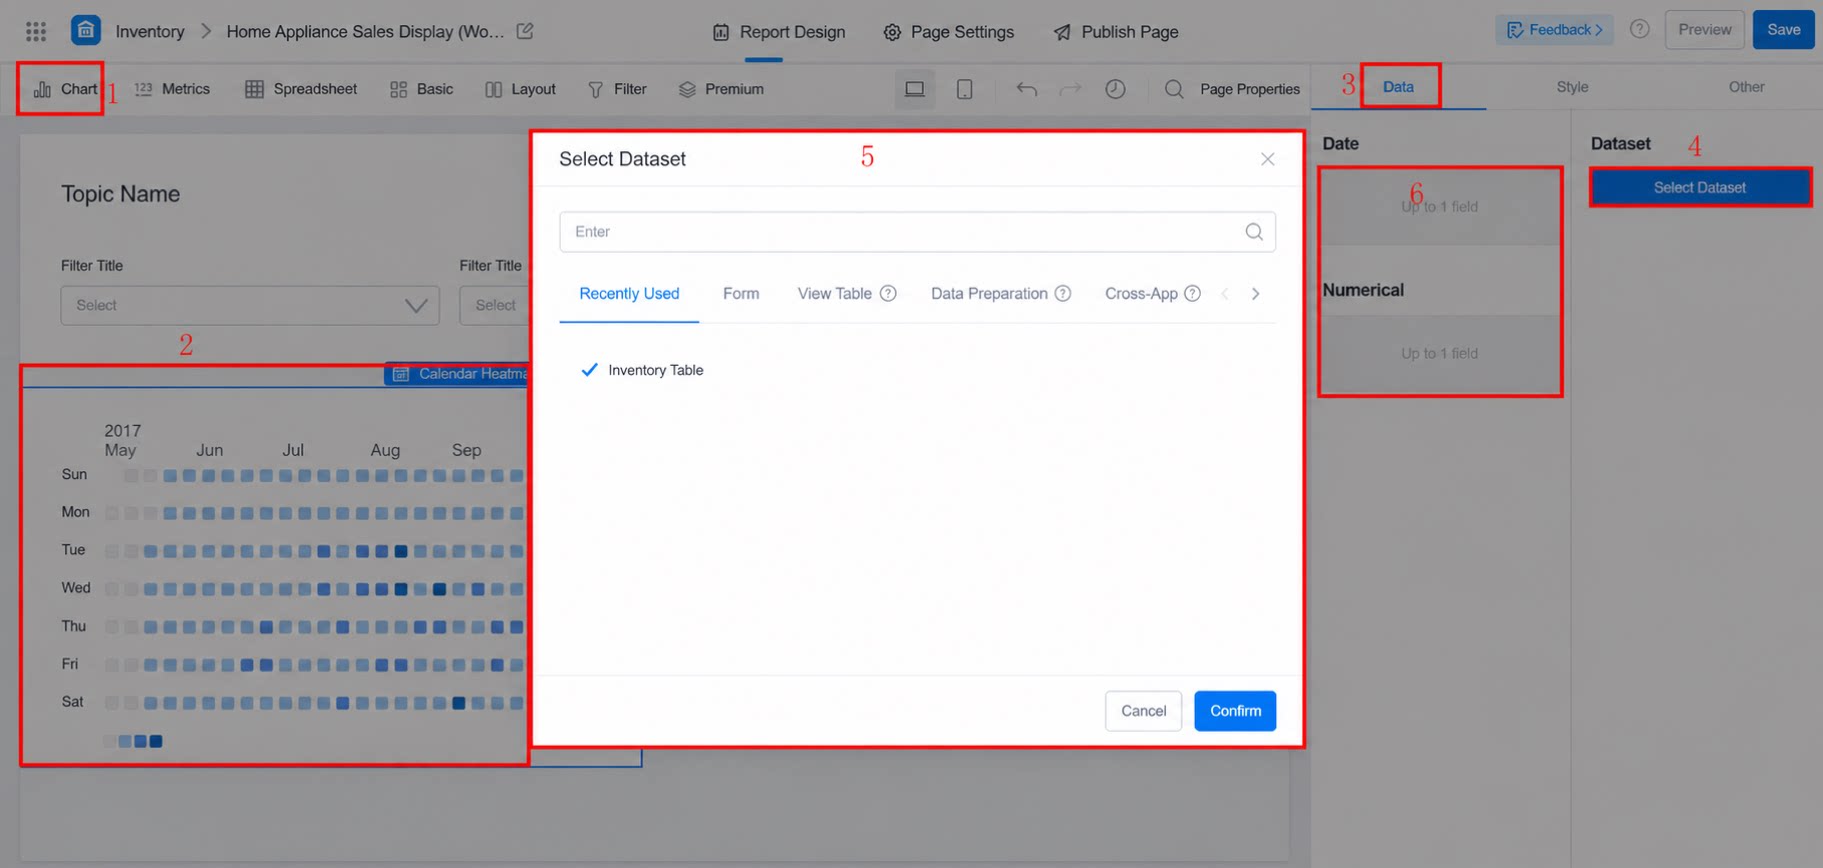
2.3 Style Settings
2.3.1 Block Size
Configure the size of each block in the calendar.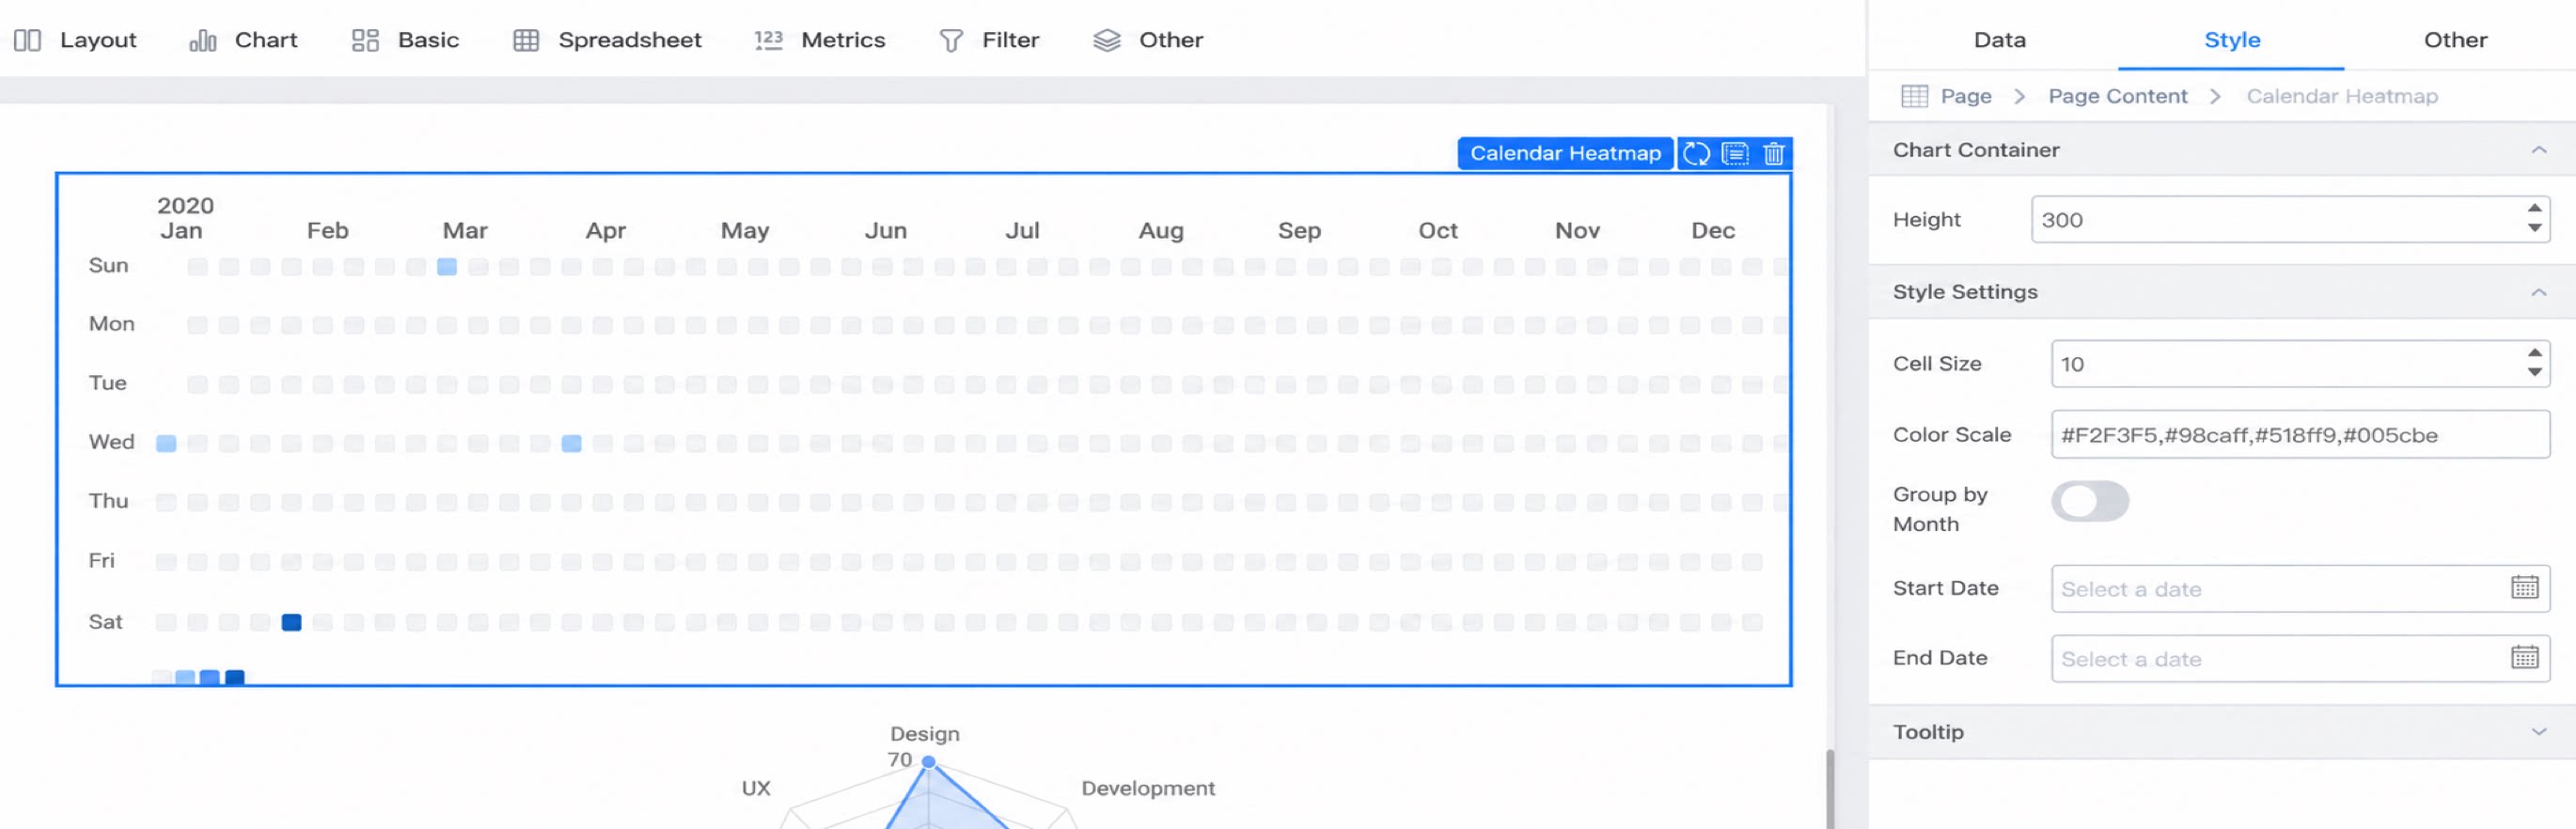
2.3.2 Gradient Colors
All numerical values are divided evenly based on the number of specified colors. The following example shows the effect when the “numerical field” ranges within [0, 19] and the “gradient colors” are #F2F3F5, #98caff, #518ff9, and #005cbe:- #F2F3F5 represents the minimum value 0
- #98caff represents values within (0, 7]
- #518ff9 represents values within (7, 14]
- #005cbe represents values within (14, +∞]