Chats
Chats Calendar
 Meetings
 Contacts
 Mail
Mail Docs
Docs Drive
Drive AI Table
 AI Minutes
 Attendance
 Approval
 YiDA
YiDA Admin Console
1. Introduction
1.1 Use Cases
A column chart provides an intuitive view of differences across data groups and emphasizes comparison between individuals. A line chart analyzes sales trends of a product category over time to help forecast future sales. A column-line combo chart displays a column chart and a line chart at the same time. Component types: Column-line combo, Line-column combo, and Dual-axis line (all available under style settings). Highlight: Freely adjust the component size and move the component to any position (left, center, or right).1.2 Basic Requirements
The basic requirements for the column-line combo chart are as follows:2. Steps
2.1 Select the Component and Configure the Dataset
Create a report, add a column-line combo chart, and select a dataset.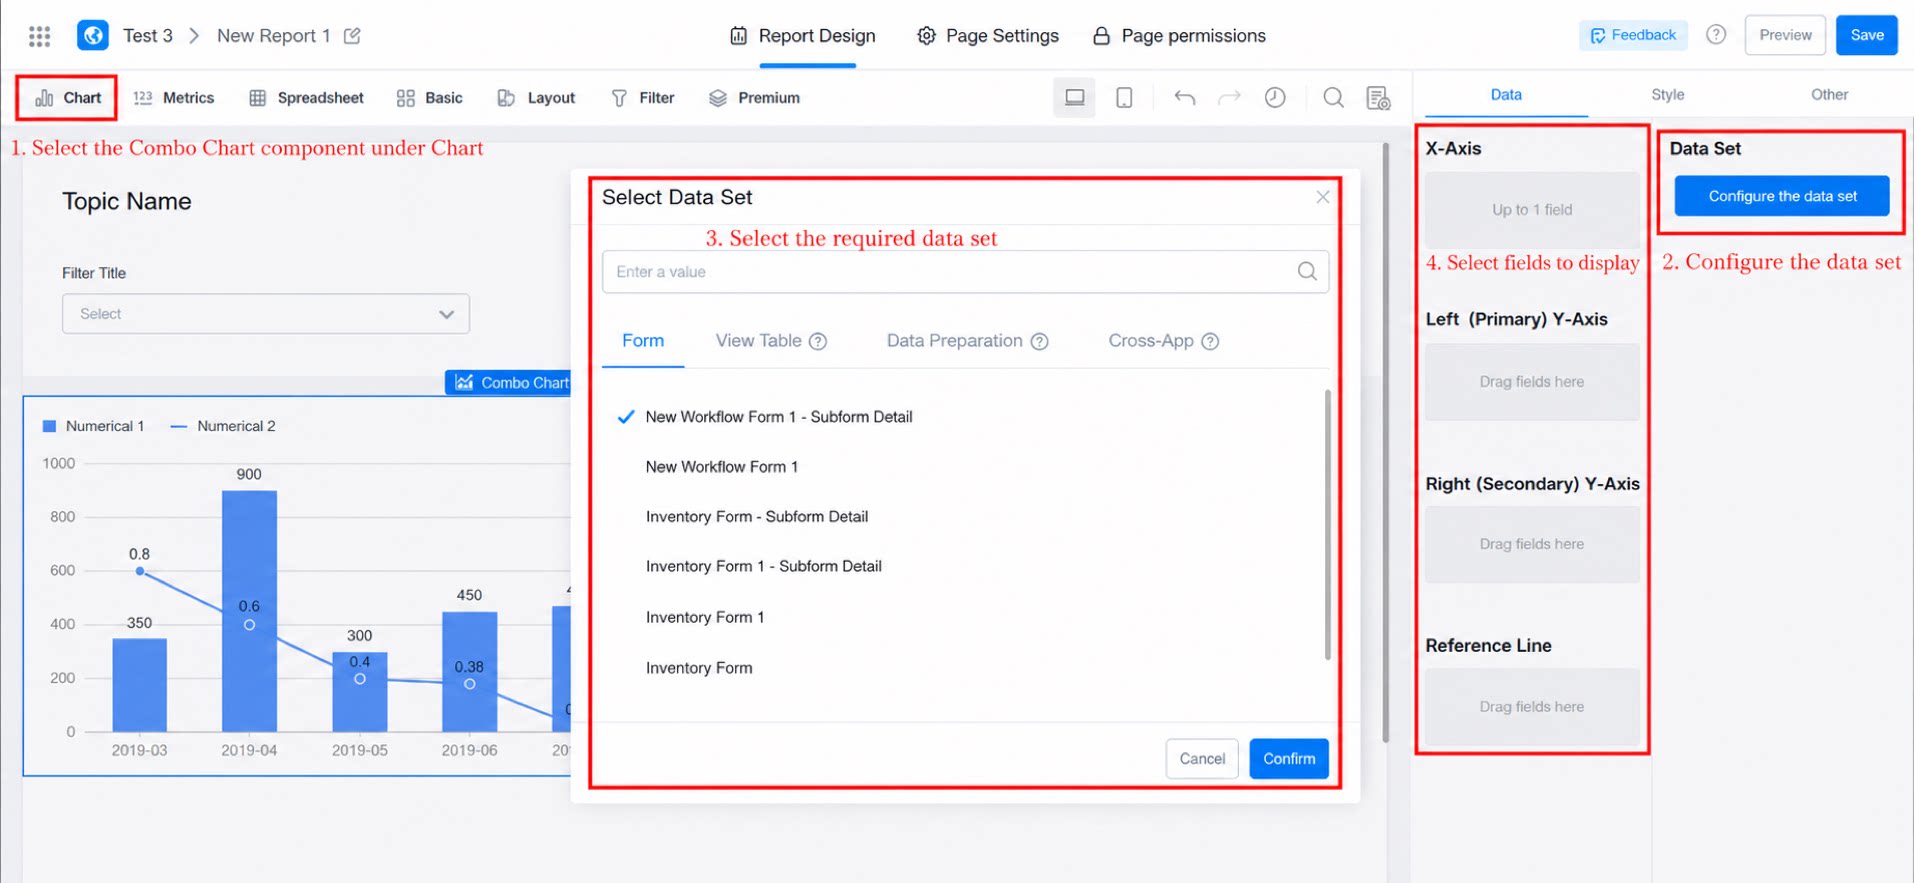
2.2 Select Fields to Display in the Chart
Drag the fields on the right onto the X-Axis, Left Y-Axis, Right Y-Axis, and Reference line areas.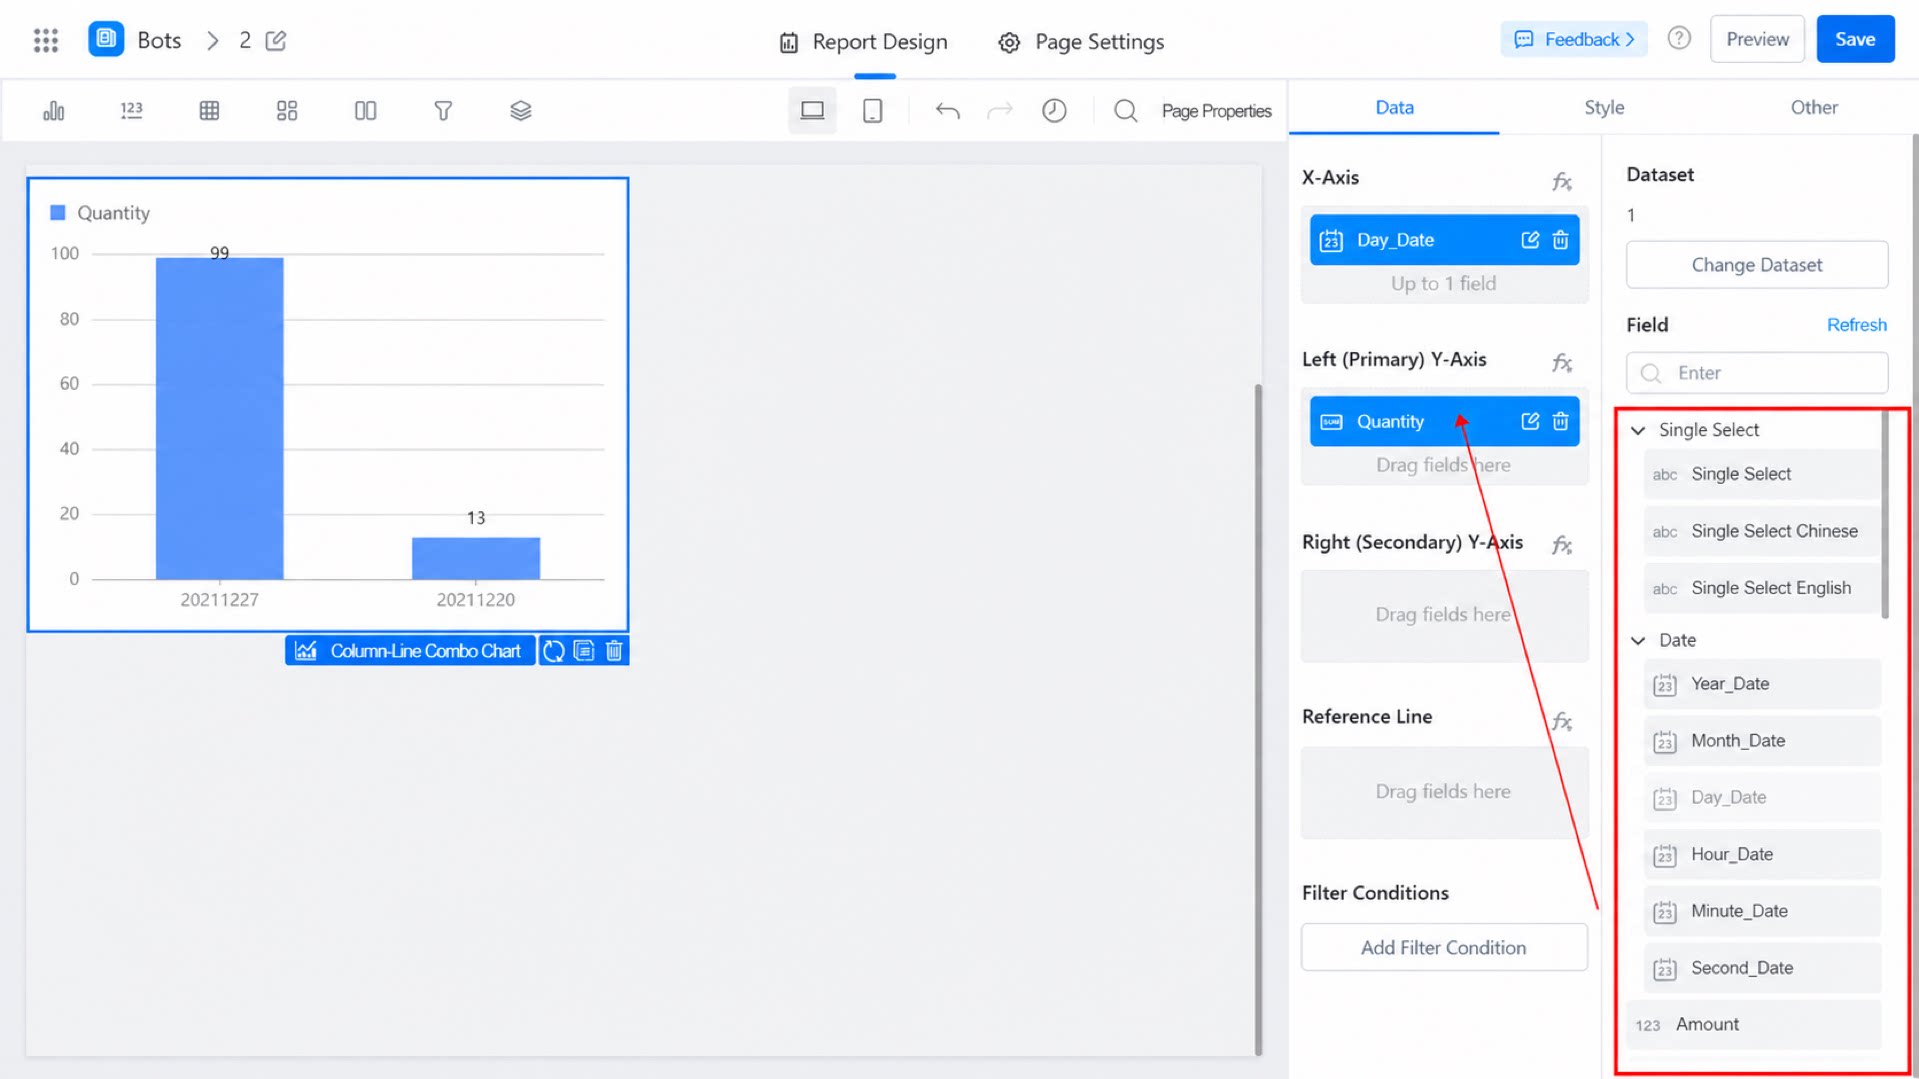
- X-Axis: The X-Axis of the column chart.
- Left Y-Axis: The left Y-Axis of the column chart.
- Right Y-Axis: The right Y-Axis of the column chart.
- Reference line: Multiple reference lines are supported.
- Conditional filter: Supported.
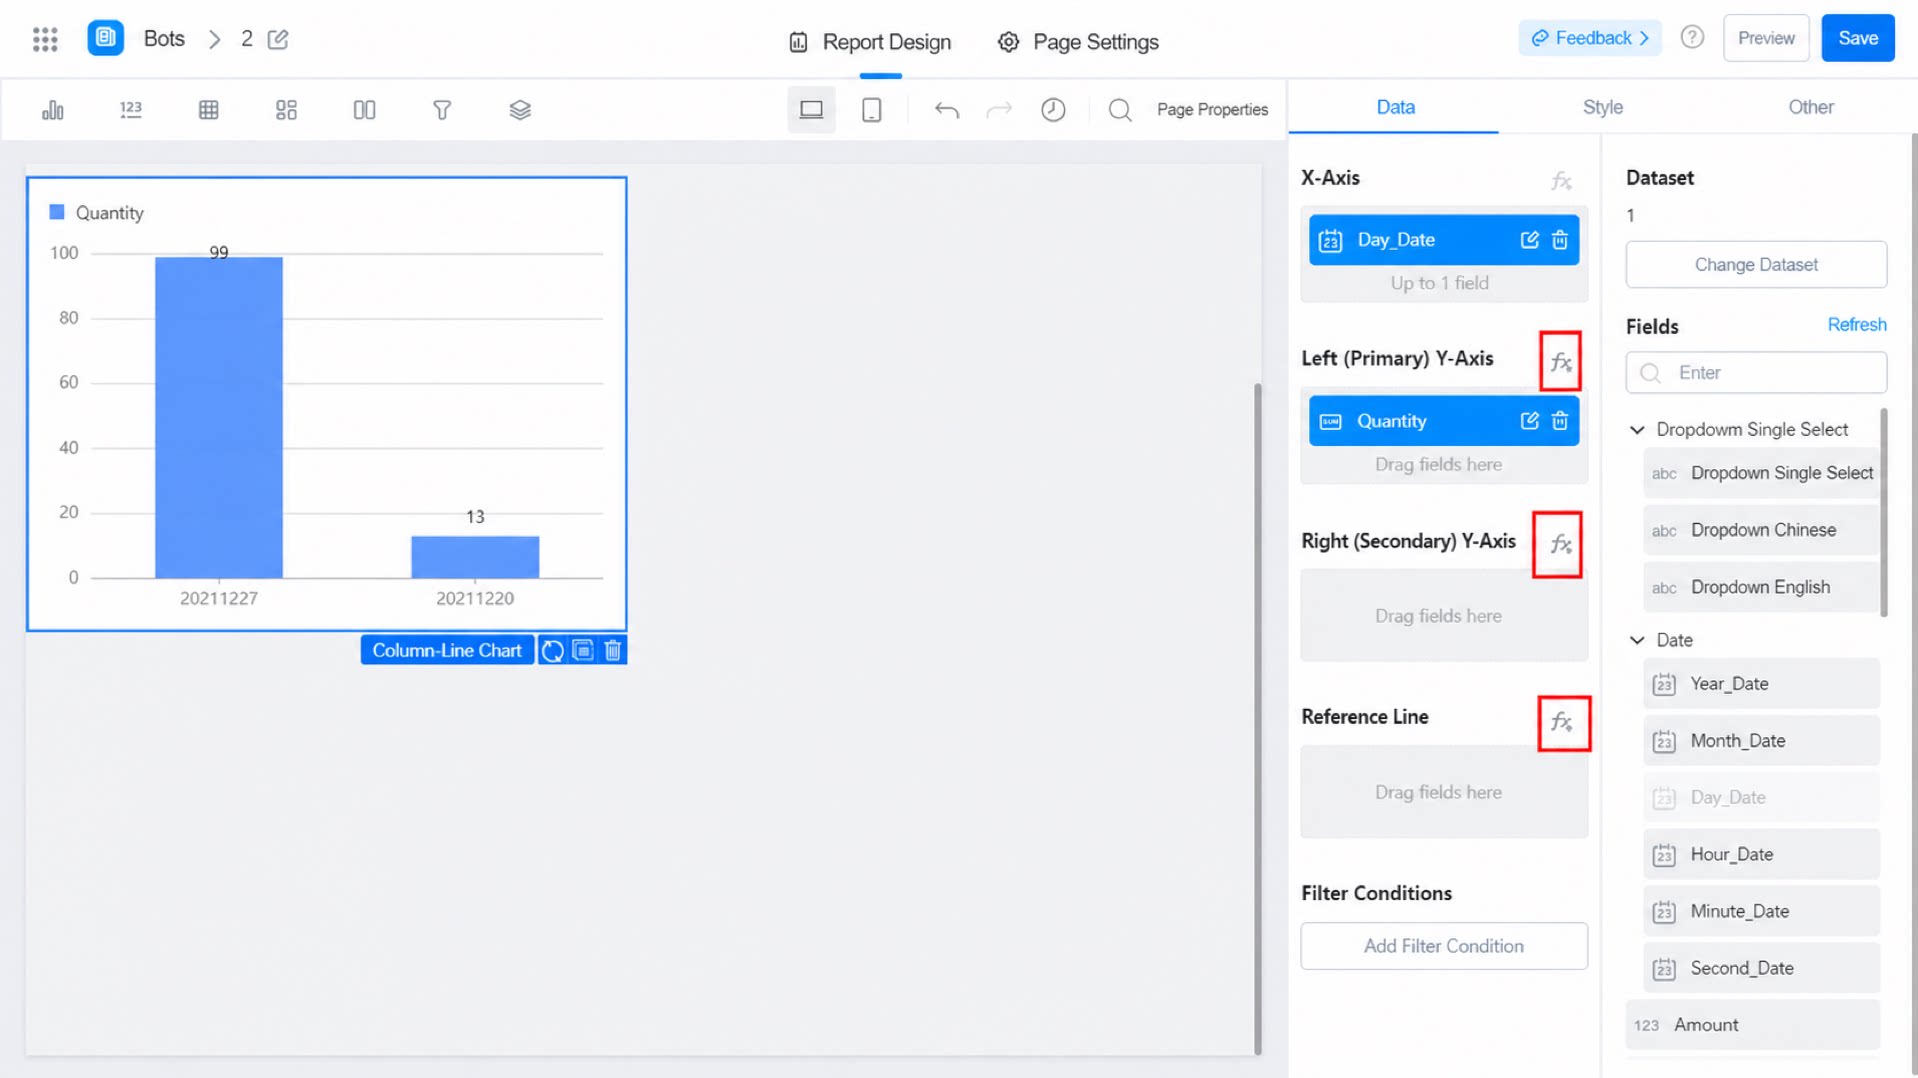
2.3 Configure Data
Hover over the X-Axis, Left Y-Axis, or another area on the right, and click the edit button to the right of the field, as shown below: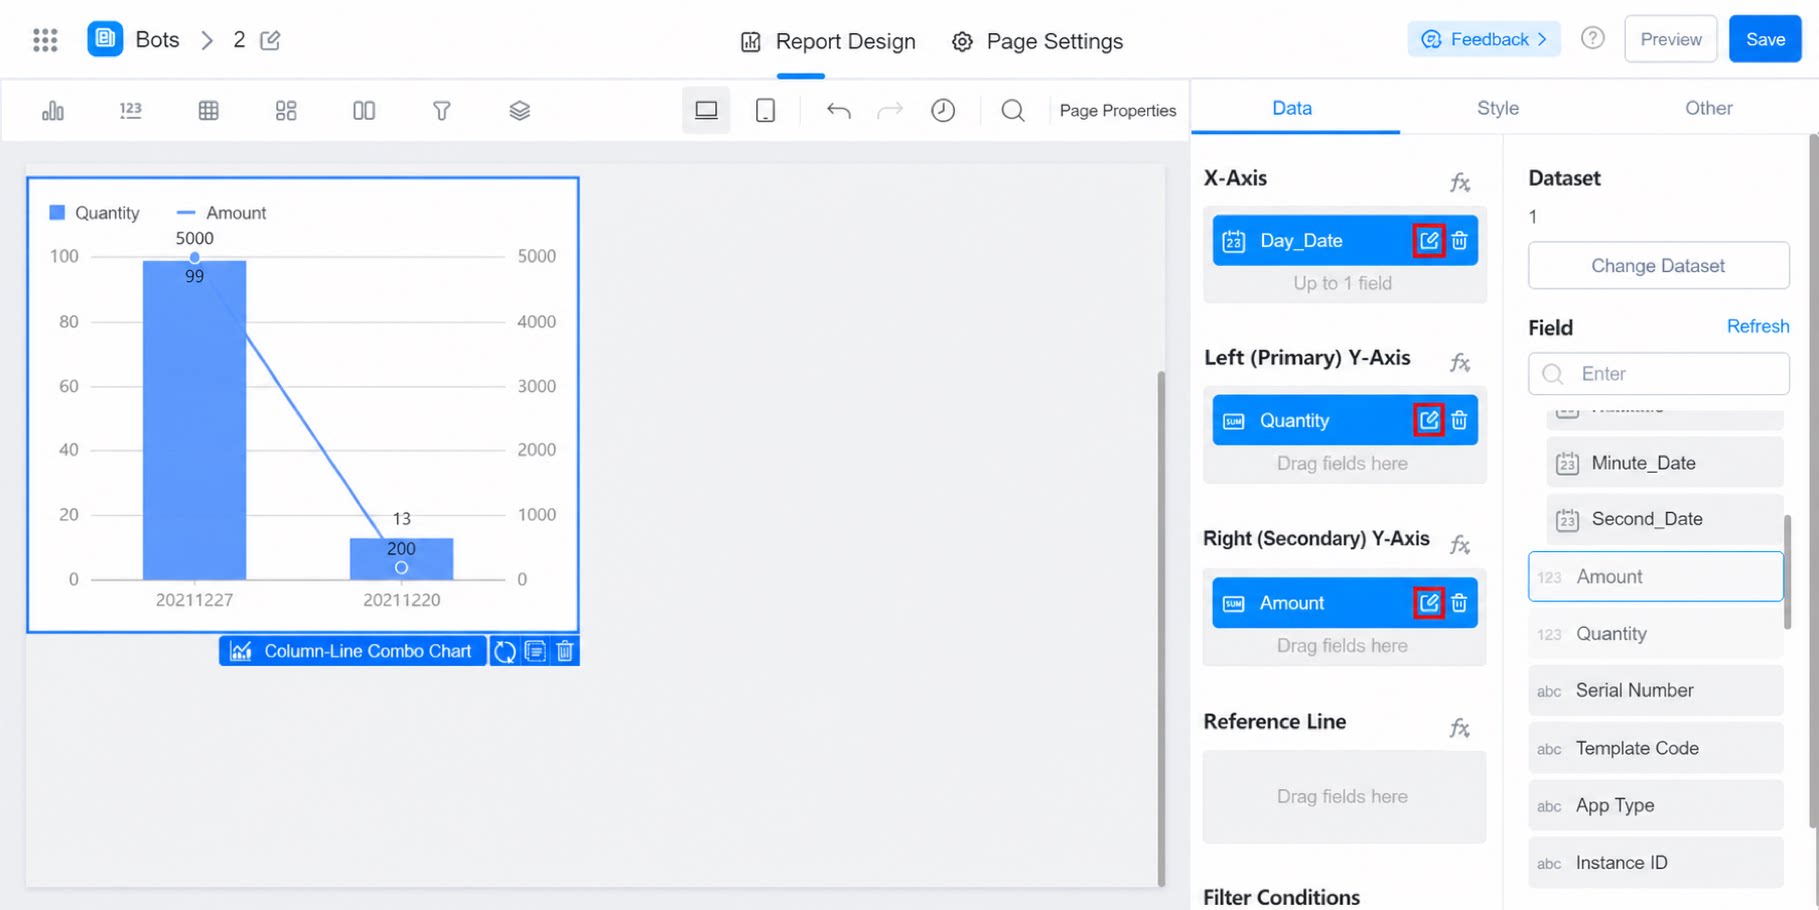
2.3.1 Aggregation (Y-Axis)
This is a Yuque content card. Click the link to view: https://www.yuque.com/go/doc/489015602.3.2 Sort (X-Axis, Y-Axis)
Note: For column chart sorting, only one of X-Axis, Y-Axis, or Group can be configured at a time. This is a Yuque content card. Click the link to view: https://www.yuque.com/go/doc/48901784
2.3.3 Formatting (X-Axis, Y-Axis)
This is a Yuque content card. Click the link to view: https://www.yuque.com/go/doc/489018722.3.4 Link (Y-Axis)
This is a Yuque content card. Click the link to view: https://www.yuque.com/go/doc/489019722.3.5 Graphic Style (Y-Axis)
This is a Yuque content card. Click the link to view: https://www.yuque.com/go/doc/489022612.3.6 Field Information (X-Axis, Y-Axis)
This is a Yuque content card. Click the link to view: https://www.yuque.com/go/doc/489023502.3.7 Reference Line Style
This is a Yuque content card. Click the link to view: https://www.yuque.com/go/doc/489025352.4 Style Settings
Style settings are divided into eight subcategories: Style, X-Axis, Left (primary) Y-Axis, Right (secondary) Y-Axis, Legend, Label (left and right), Slider axis, and Tooltip, as shown below: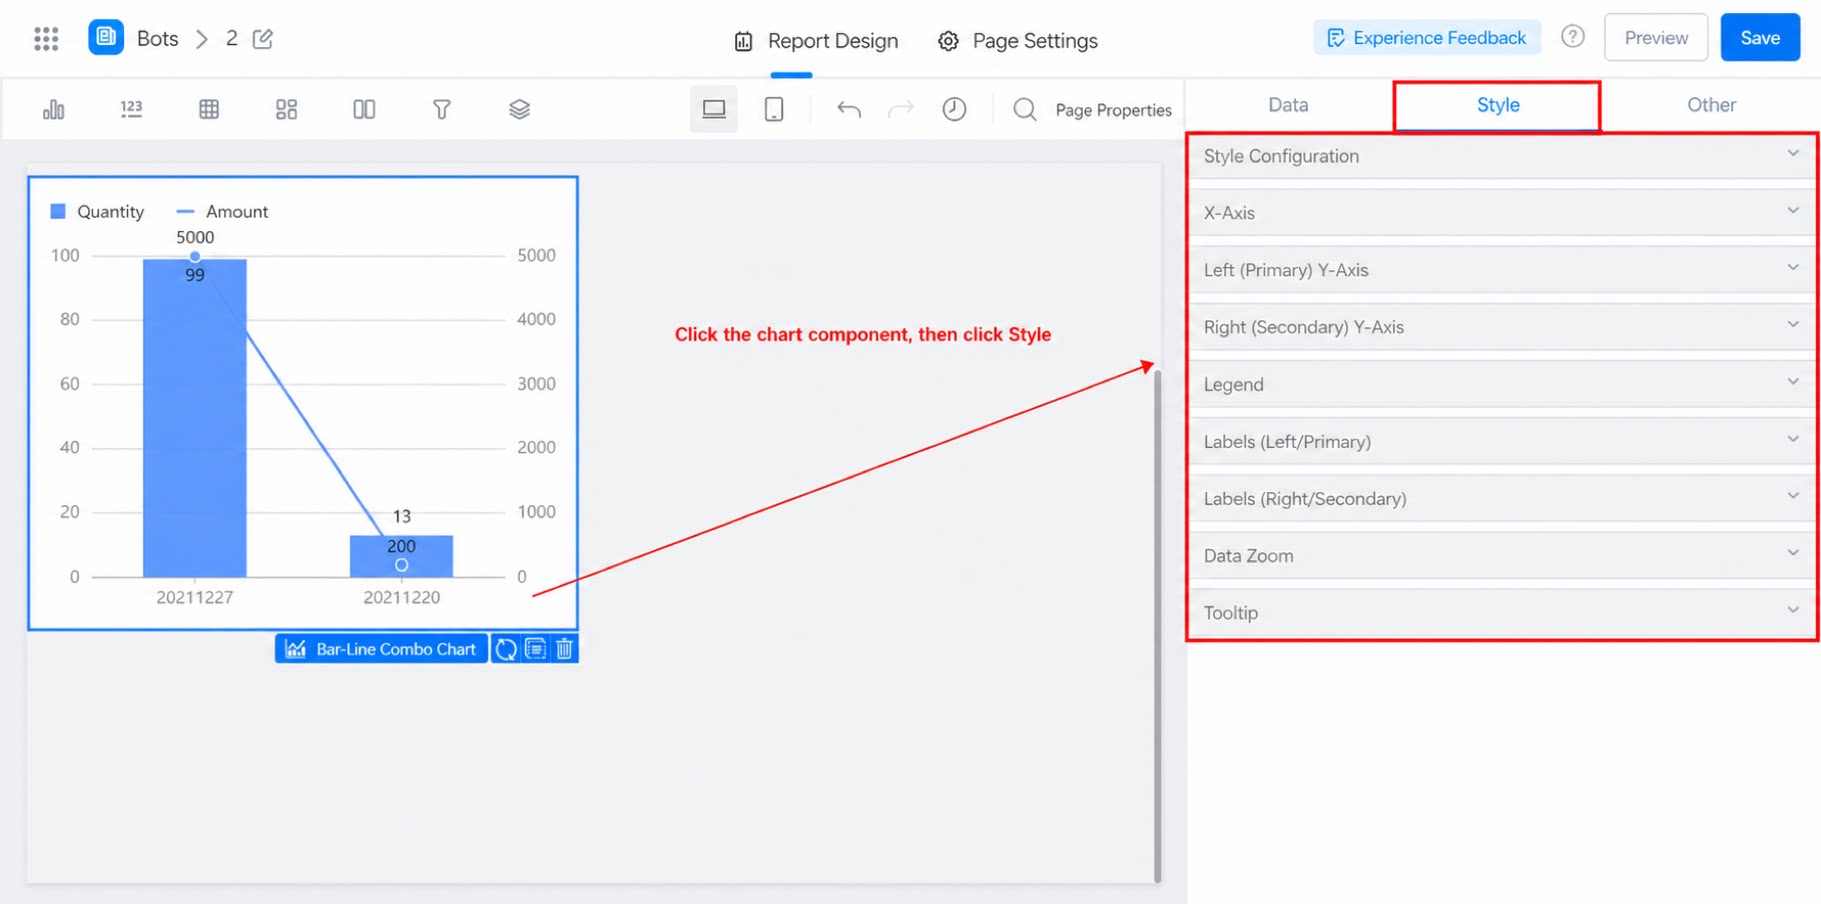
2.4.1 Style
Color adjustment is supported. Chart type: Column-line combo, Line-column combo, and Dual-axis line. Column settings: Adjust column thickness and toggle the stacked layout. Line settings: Configure line thickness, curve, point display, size, and point shape. Style settings. Display after configuration.2.4.2 X-Axis
Basic settings. Try them out to see the effect, as shown below: X-Axis settings. Display after configuration.2.4.3 Y-Axis (Left and Right)
Basic settings, similar to the X-Axis settings, as shown below: Y-Axis (left and right) settings.2.4.4 Legend
Supports On and Close. When On, the position and paging can be adjusted (On by default), as shown below: Legend display.2.4.5 Label (Left and Right)
Supports On and Close. When On, position, font size, and color can be adjusted (black by default), as shown below: Label settings.2.4.6 Slider Axis
Supports On and Close. When On, the start and end range can be adjusted (values between 0 and 1), as shown below: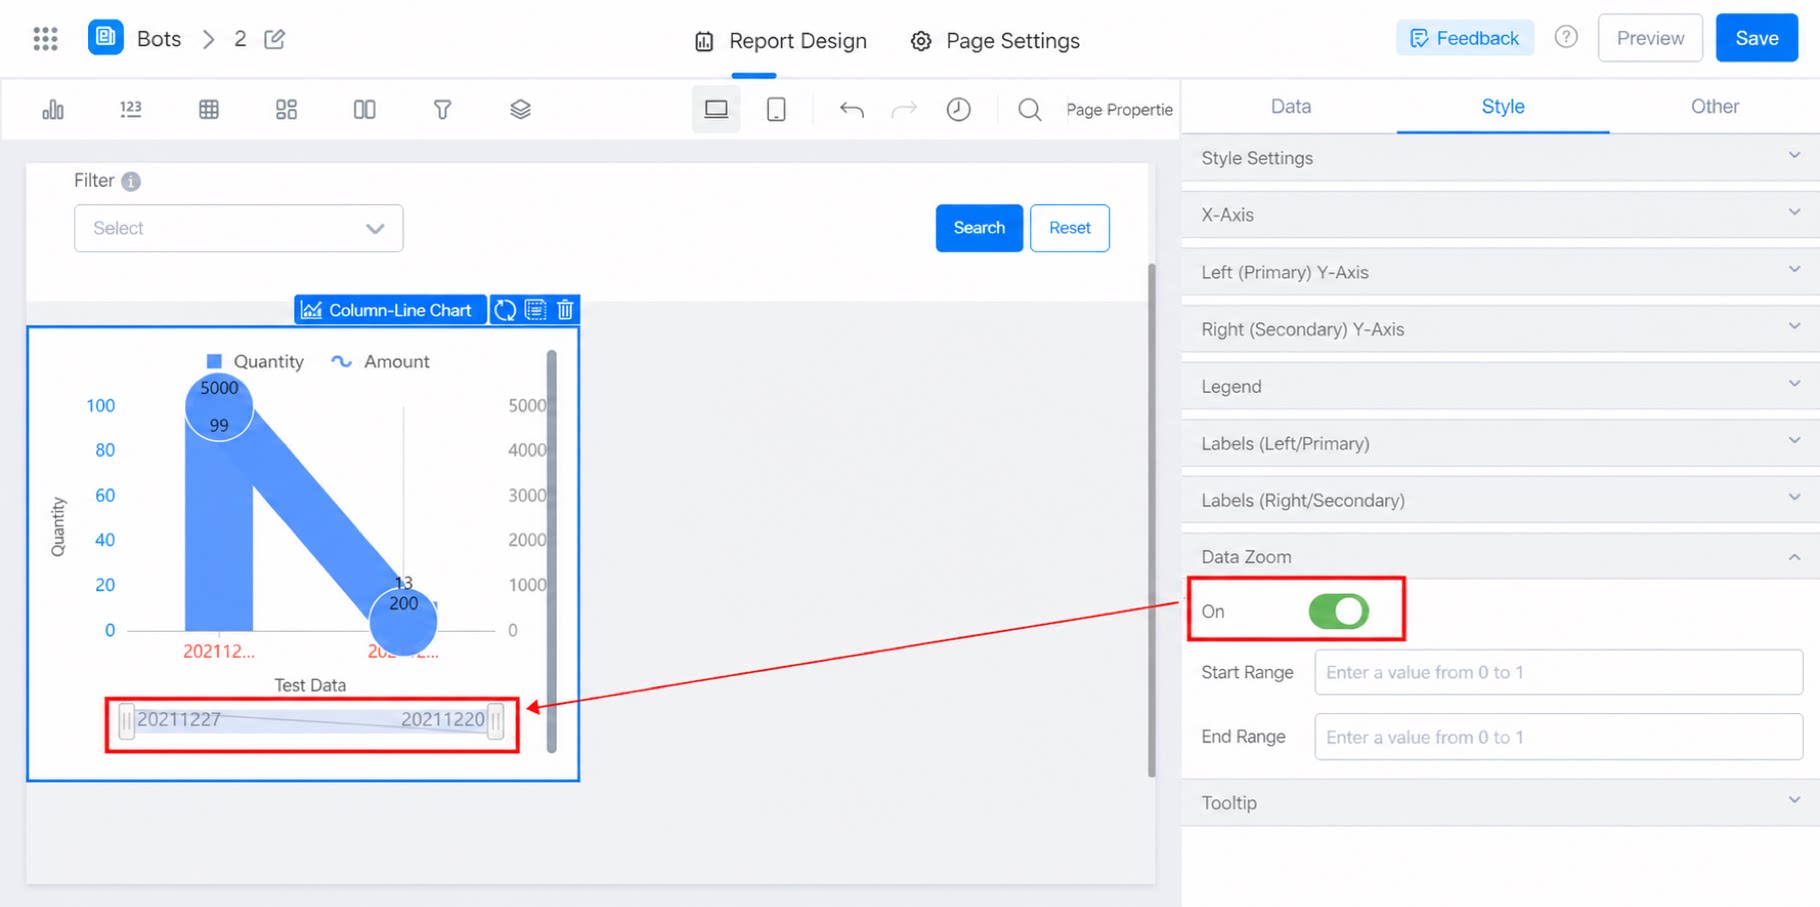
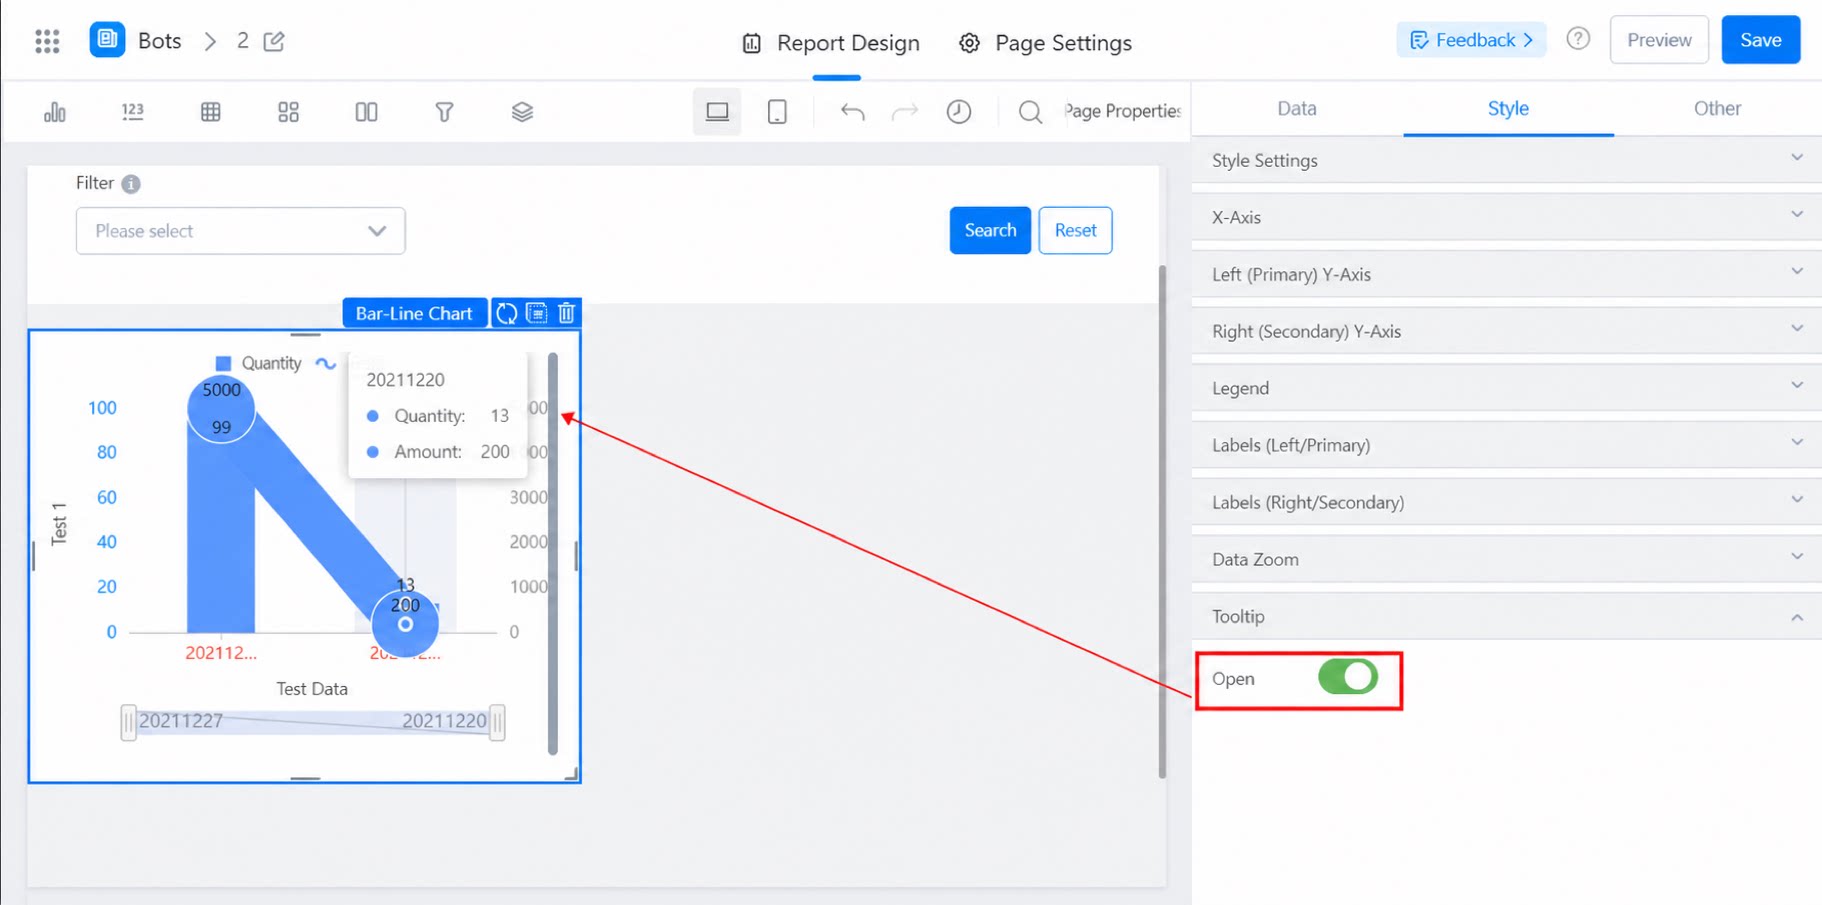
2.4.7 Tooltip
Supports On and Close. When On, information appears on mouse hover. Effect when enabled: