Chats
Chats Calendar
 Meetings
 Contacts
 Mail
Mail Docs
Docs Drive
Drive AI Table
 AI Minutes
 Attendance
 Approval
 YiDA
YiDA Admin Console
1. Overview
1.1 Feature Overview
A Funnel chart measures business performance across key stages by illustrating each stage of a business process. It offers an intuitive view of the conversion rate at each stage. In a sense, a Funnel chart is a specialized application of path analysis, focused on conversion analysis for critical paths. Take a Taobao purchase as an example. Buying an item on Taobao involves the following stages: Browse → Add to cart → Pay → Receive → Review Highlights: You can freely adjust the component size and move the component position (left-aligned, center-aligned, or right-aligned).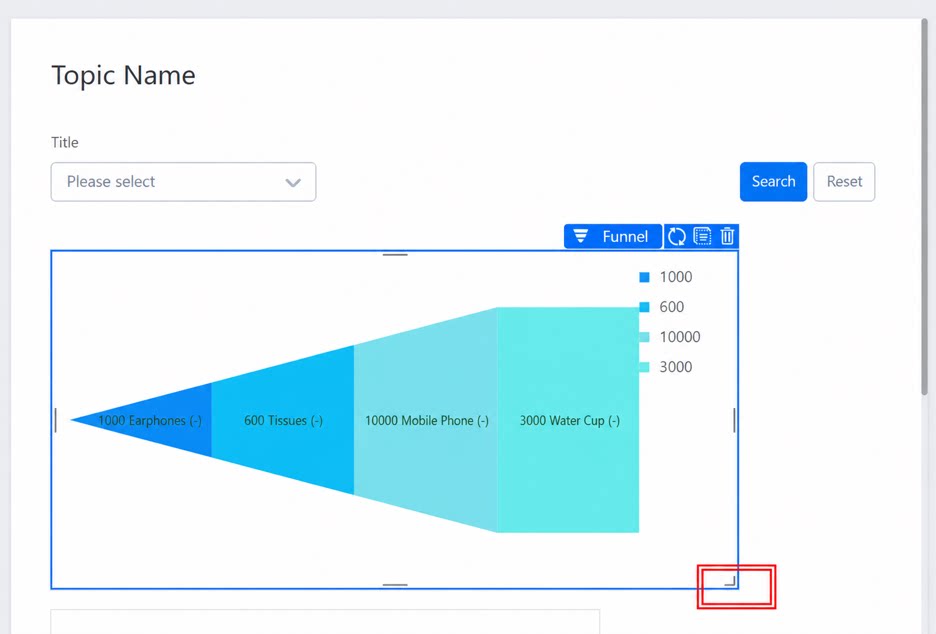
1.2 Use Cases
Buying an item on Taobao involves the following stages: Browse → Add to cart → Pay → Receive → Review1.3 Basic Requirements
Basic requirements for a Funnel chart:2. Procedure
2.1 Select the Component and Configure the Dataset
Create a report, add the Funnel chart component, and select a dataset.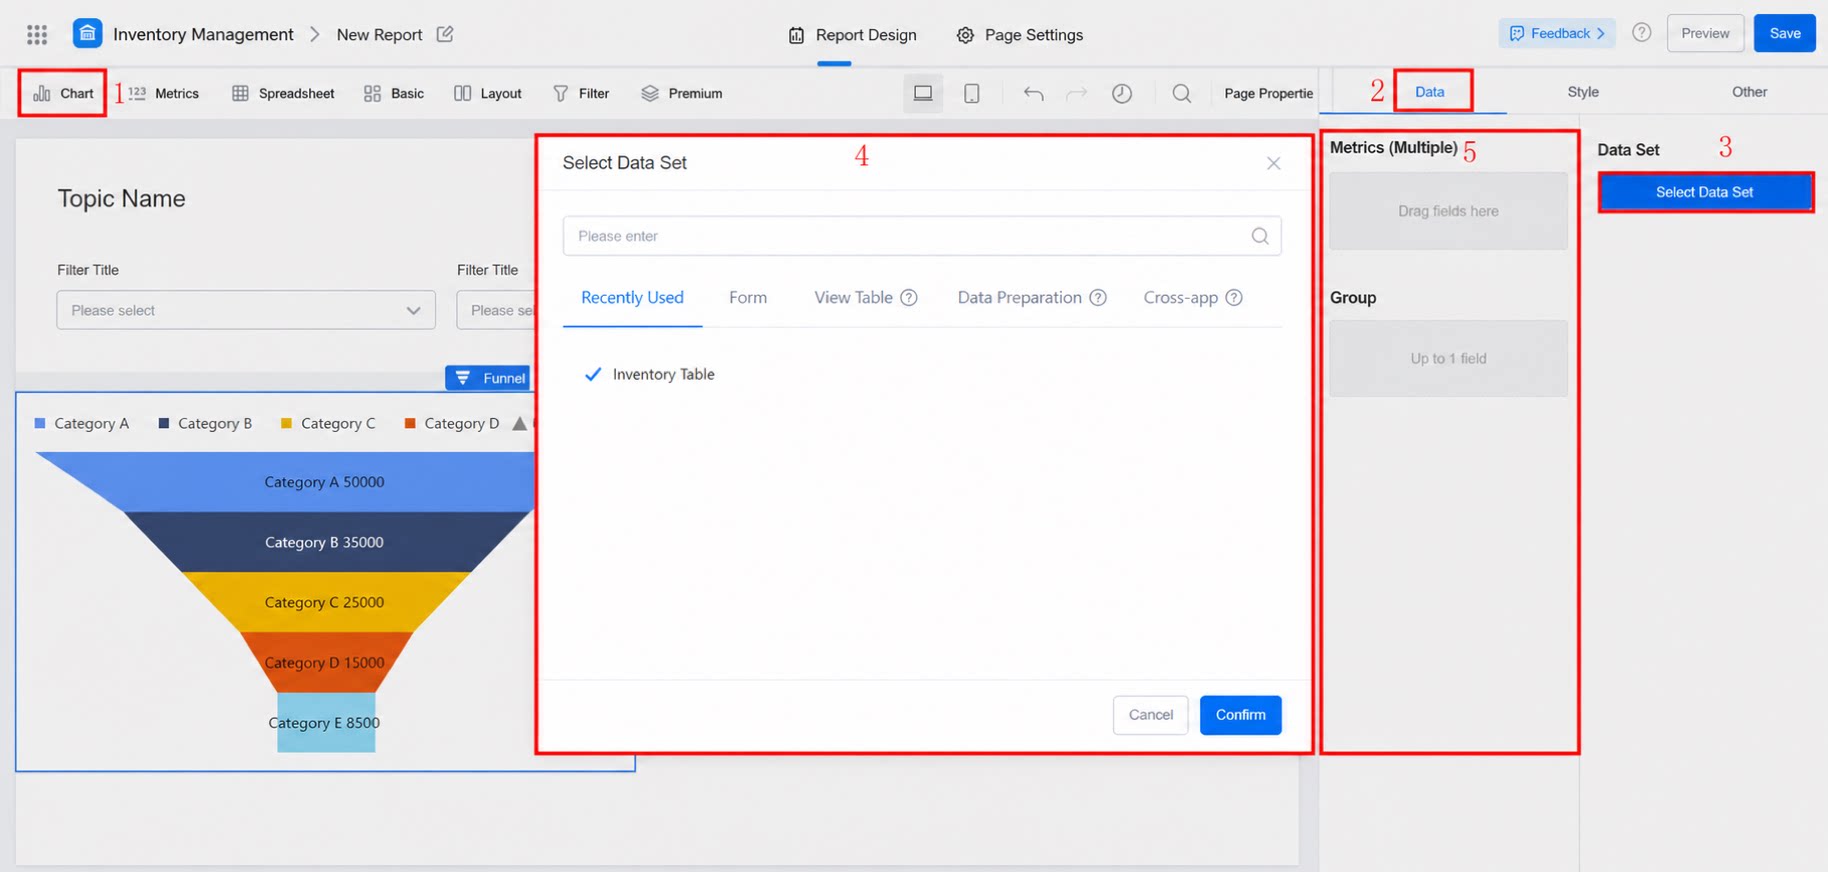
2.2 Select Fields to Display in the Chart
Drag fields from the right panel to Metrics and Group. You can either select fields directly from the dataset or generate them using a formula. For instructions on using formulas, see Report formulas.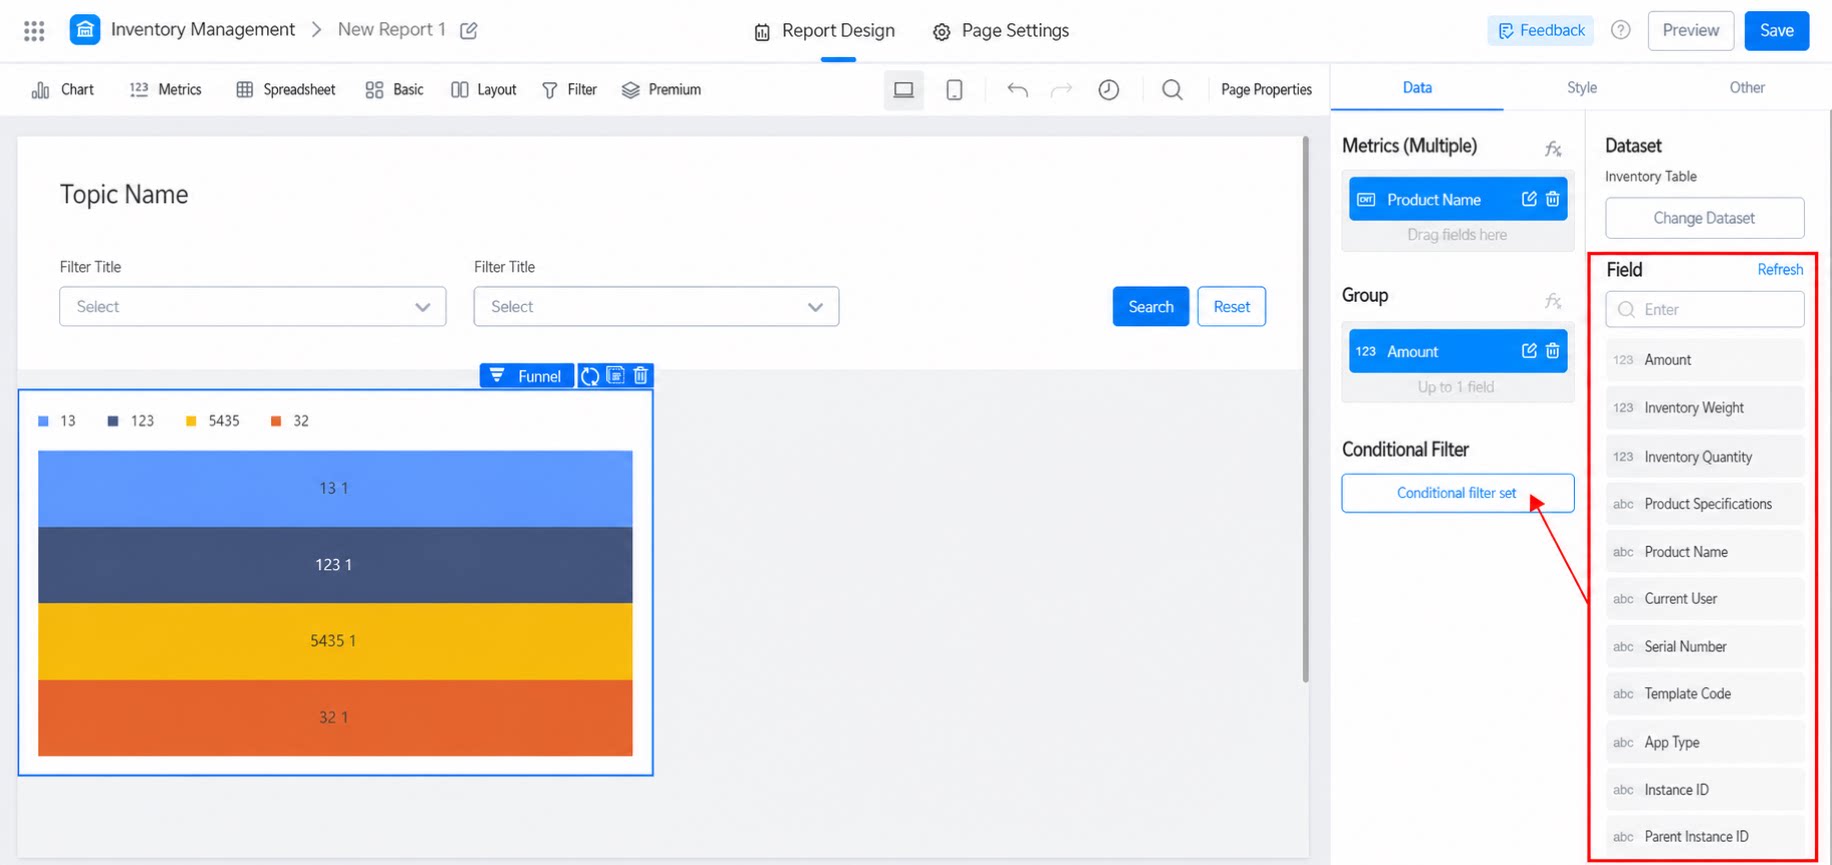
2.2.1 Data Settings Panel
You can sort, format, and perform other actions on the displayed fields.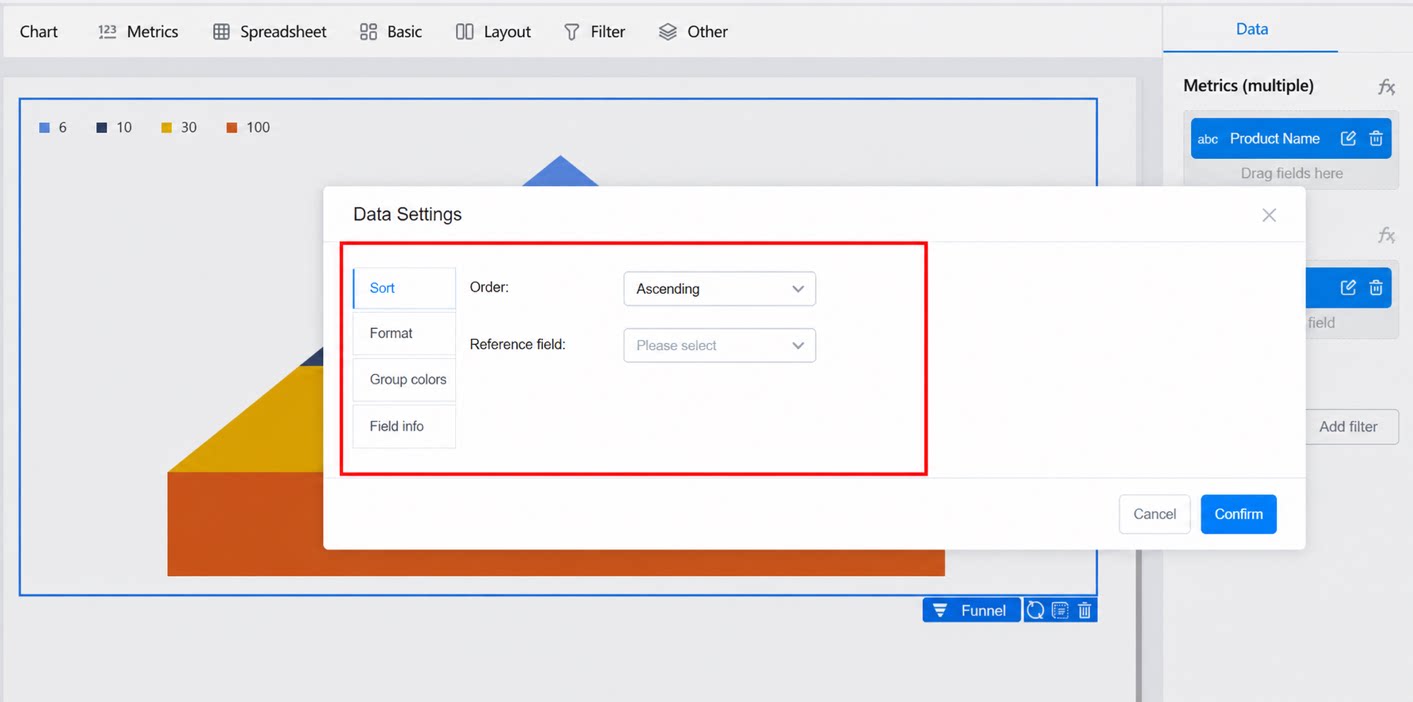
2.3 Configure Data
You can refer to the data configuration instructions for the Column-Line Combo chart. This is a Yuque content card. Click the link to view: Column-Line Combo chart.2.4 Style Settings
Style settings are divided into six categories: style configuration, category order, labels, percent decimal places, legend, and tooltips, as shown below: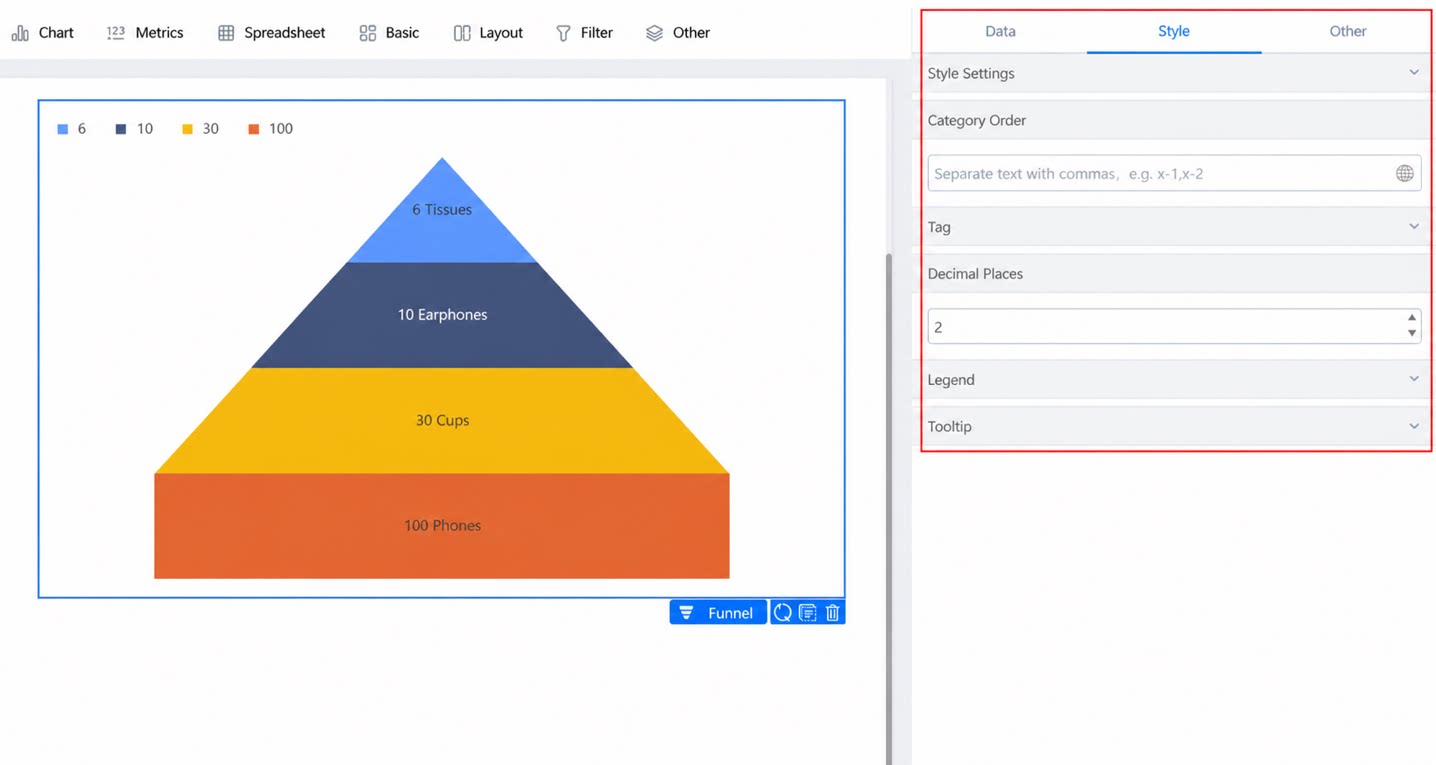
2.4.1 Style Configuration
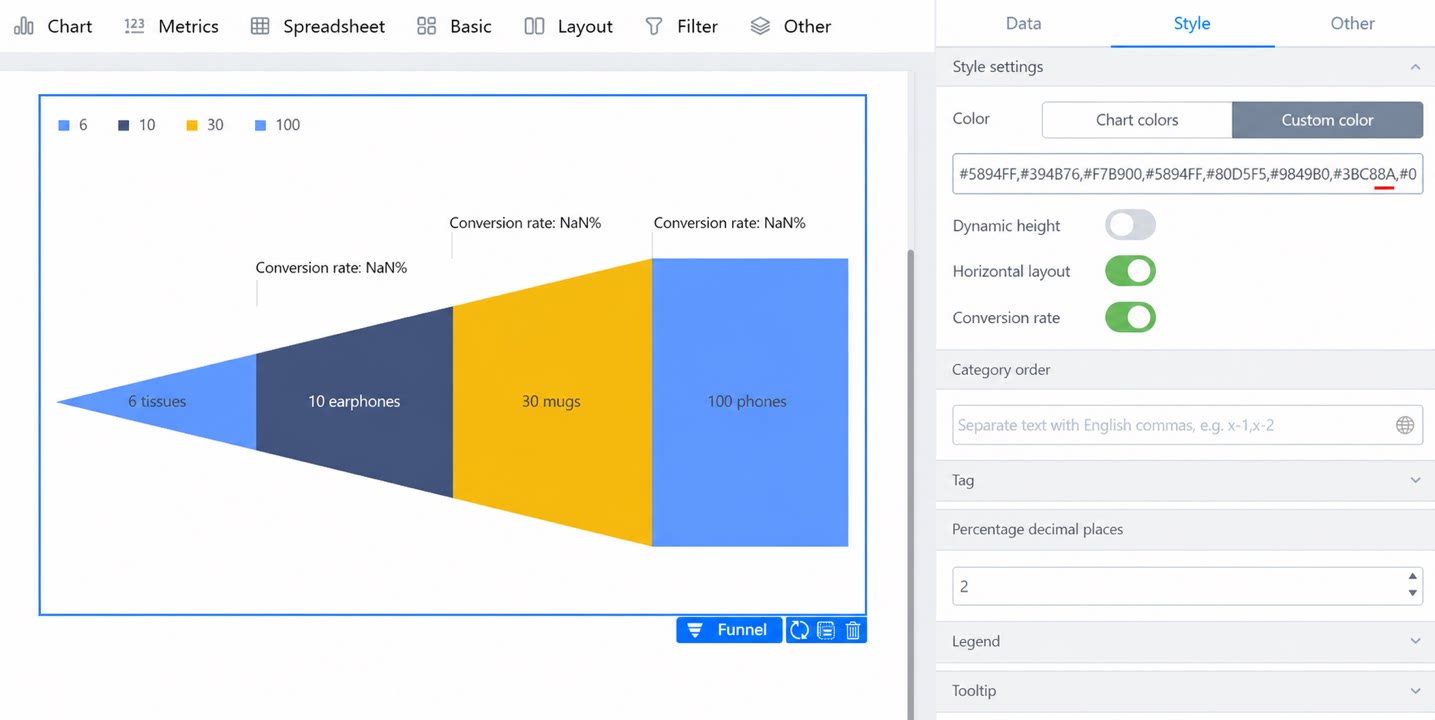
You can adjust the funnel colors, enable or disable dynamic height, horizontal layout, and conversion rate, and change the group order.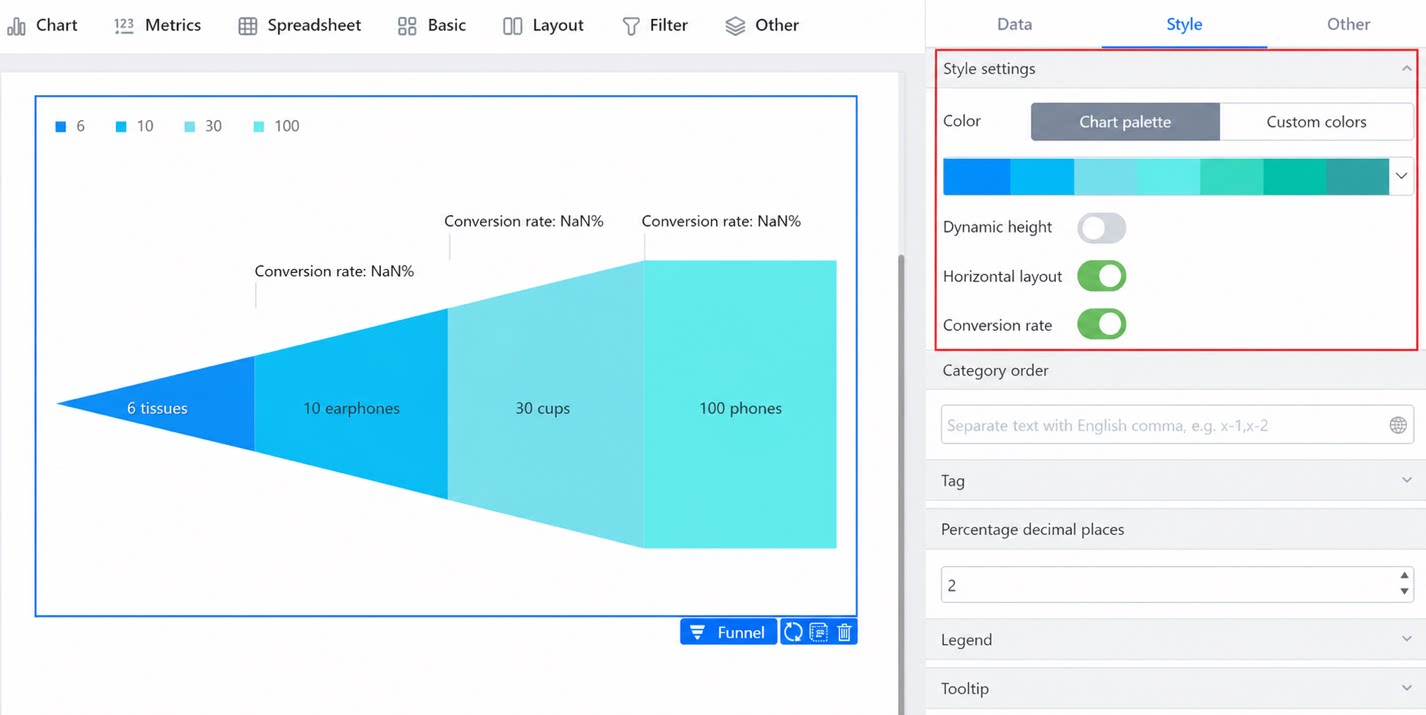
2.4.2 Dynamic Height
The height of each funnel layer changes based on the value. See the screenshots below for a clear comparison: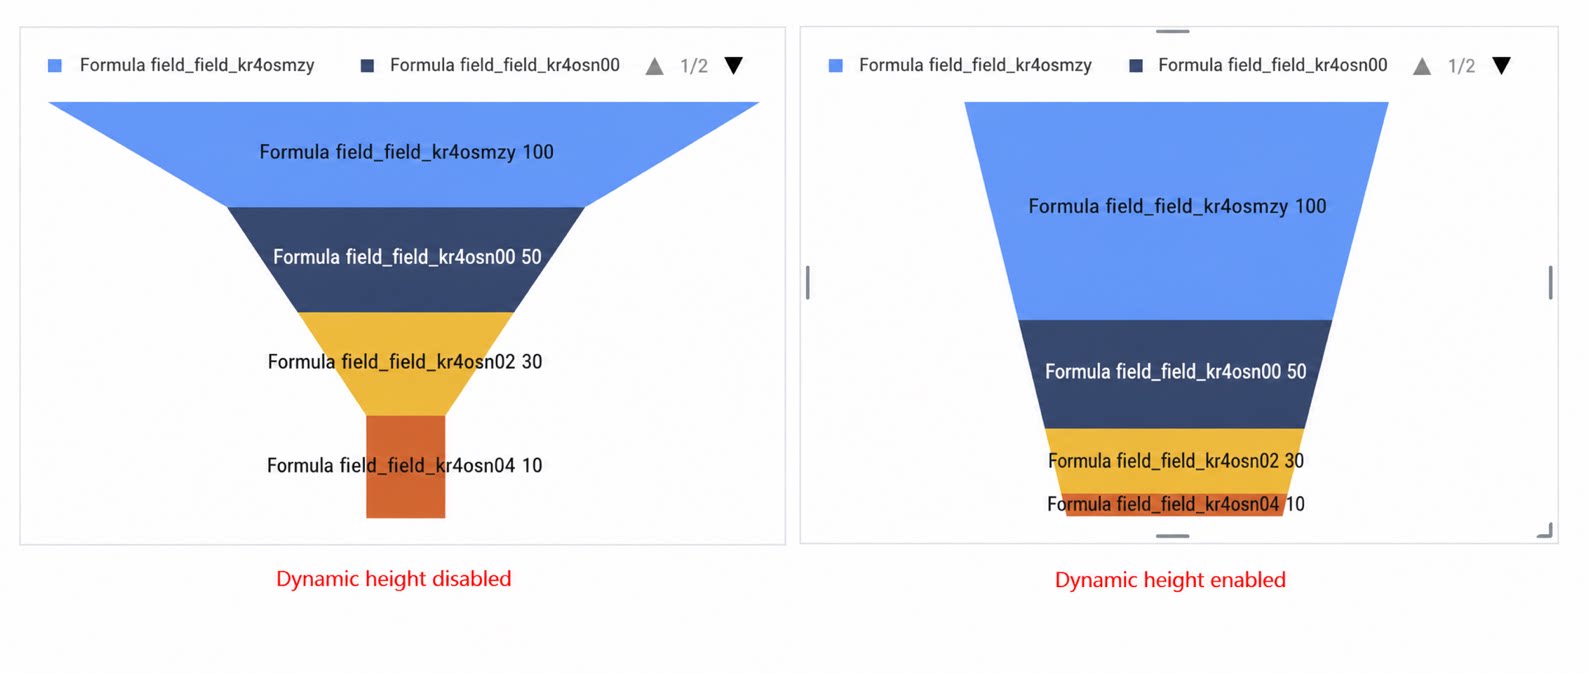
2.4.3 Horizontal Layout
Displays the Funnel chart horizontally, as shown below: Horizontal display.2.4.4 Conversion Rate
The following example illustrates this feature. For example, in a Taobao shopping scenario, if the number of product page views is 10,000 and 4,000 items are added to cart, the conversion rate is 40% (4,000/10,000). Display effect when conversion rate is on. Display effect when conversion rate is off.2.4.5 Category Order
Separate category names with commas. For example: Product page views, Order reviews, Added to cart, Orders created, Orders paid, Transactions completed. Set category order.2.4.6 Labels
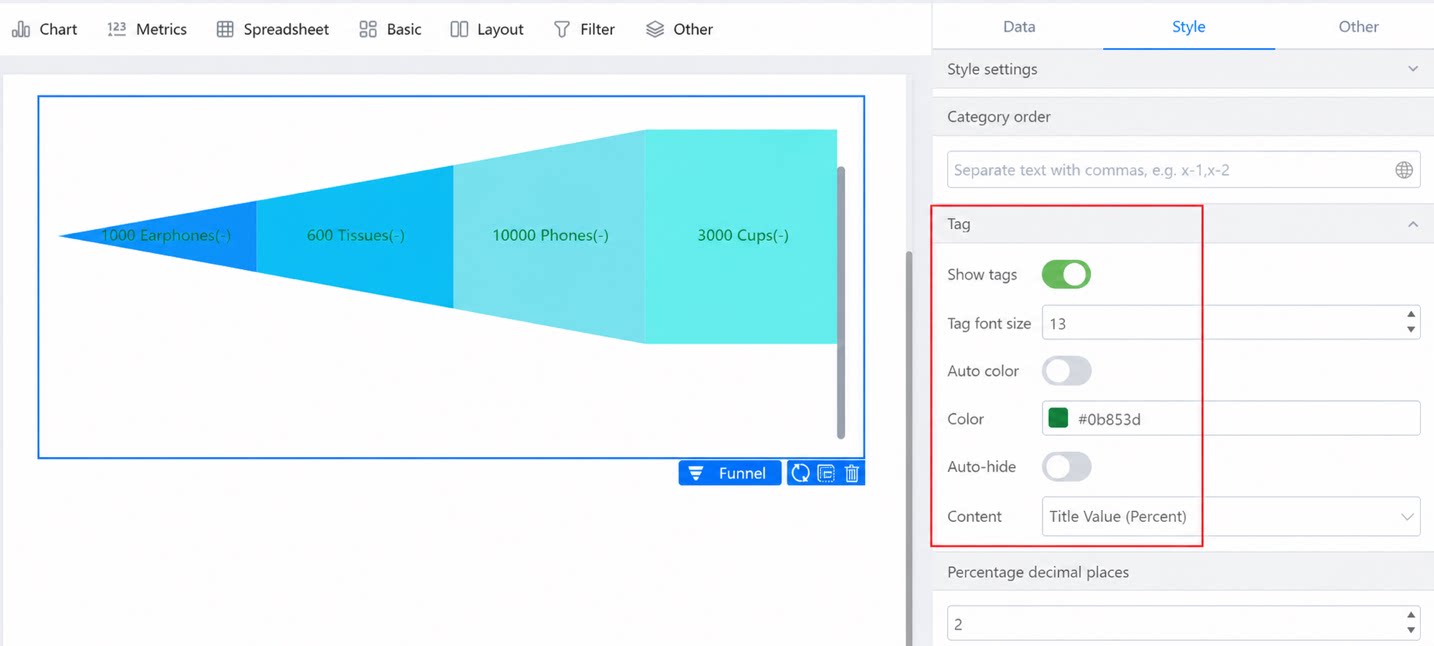
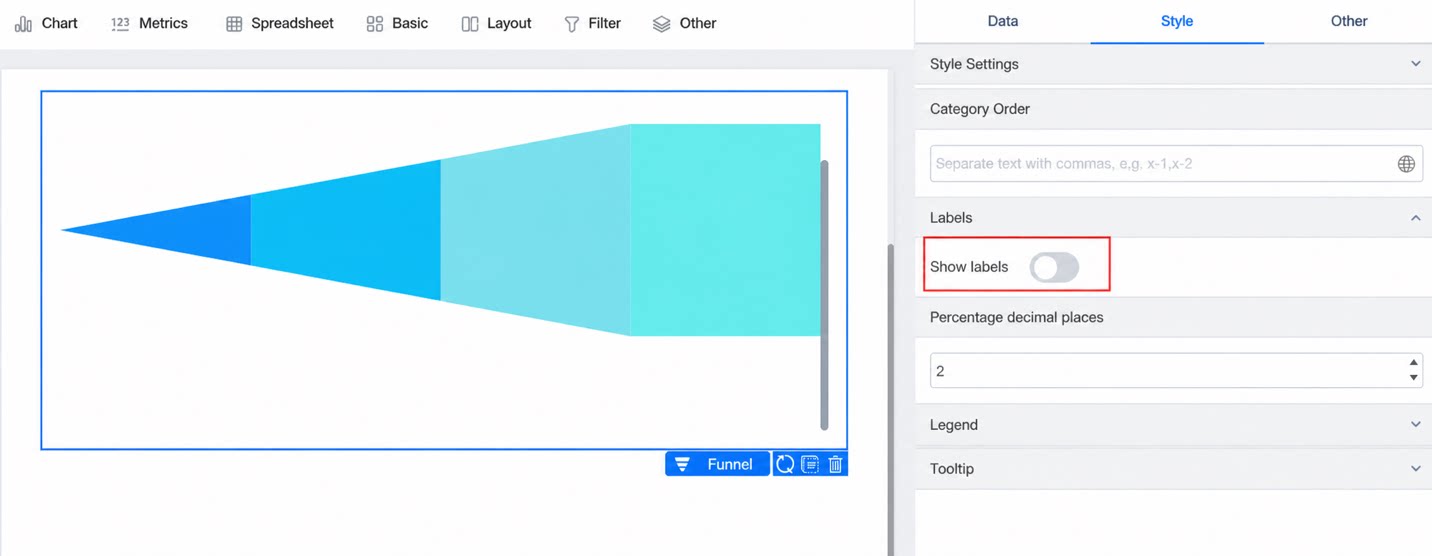
Labels can be turned on or off. When on, you can adjust the position, font size, and color (black by default).