

 Chats
Chats Calendar
 Meetings
 Contacts
 Mail
Mail Docs
Docs Drive
Drive AI Table
 AI Minutes
 Attendance
 Approval
 YiDA
YiDA Admin Console
1. Overview
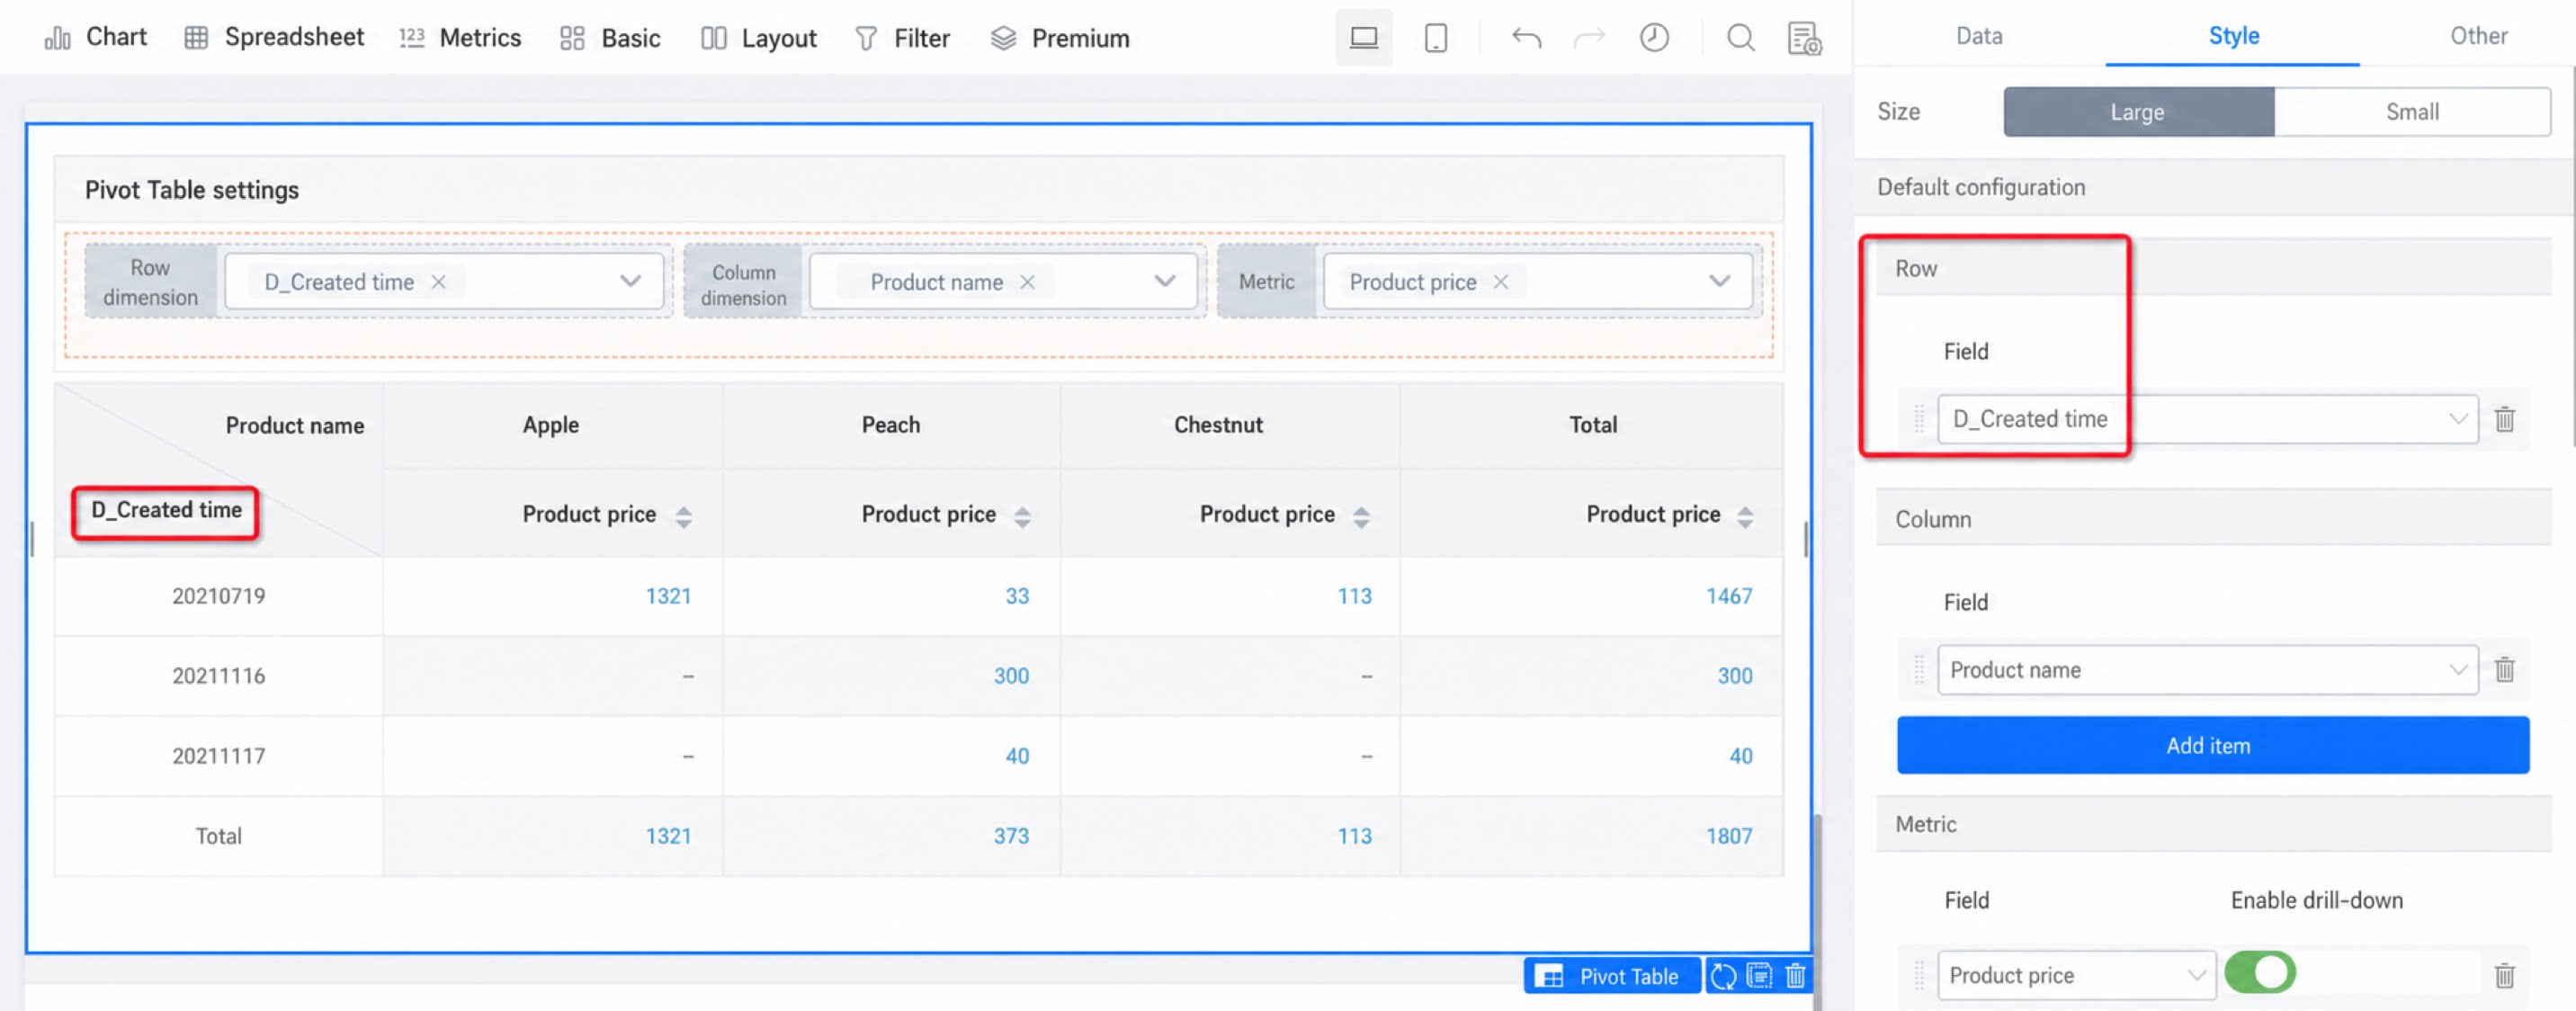
The cross table is one of the most commonly used visualization formats in daily analysis, similar to Excel. YiDA supports multi-level pivoting, metric calculation, totals and subtotals, quick filtering, and more. Additional handy actions—such as clicking a metric to reveal the underlying detail data—are also available.1.1 Example Scenarios
For example, when you need to analyze information across multiple dimensions—such as tracking a warehouse’s daily income, expenses, and totals by time granularity in a report—use the cross table to tailor your business analysis.1.2 Core Steps
- Step 1: On the Data tab, select the data list to include in the analysis.
- Step 2: Select the row dimension (only one field is allowed).
- Step 3: Select the column dimensions (multiple fields are supported, enabling multi-column cross analysis with the row chosen in Step 2).
- Step 4: Select the metrics (numeric fields are recommended; when a numeric field is used, the total is summed automatically).
2. Basic Configuration
2.1 Refer to [Basic Table]
2.1.1 Associate a Dataset
Path: Click report >> Spreadsheet >> Cross pivot table >> Data >> Dataset >> Select dataset.2.1.2 Select the Field List
(1) Select columns directly from the dataset, or generate them with a formula. To learn how to use formulas, view the tutorial. (2) Pull fields from the form.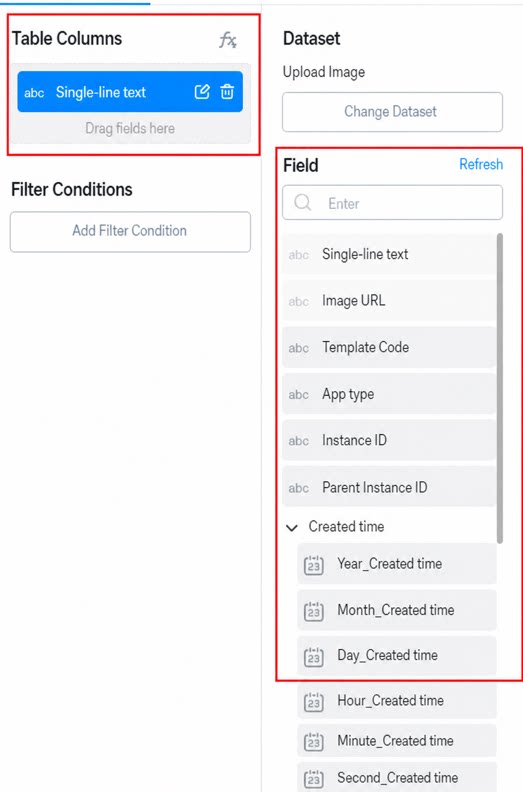
1.1.3 Configure Data
Data configuration follows the same approach as the basic table. See Basic table.3. Premium Configuration
Compared with the basic table, the Premium configuration of the cross table mainly adds row and column options within the style settings.3.1 Basic Notes
- Pagination is not supported (keep the data within what a single page can display whenever possible).
- Size: Displayed as large by default.
- Height configuration is not supported (adjust by dragging the tile).
3.2 Default Item Configuration
Once defaults are set, the row dimension, column dimension, and metrics automatically load the corresponding field information and query the data during preview and viewing.- Row: Supports one field.
- Column: Supports multiple fields.
- Metric: Supports multiple fields. Drill-down is enabled by default; click list data to open the detail page.
3.3 Basic Configuration
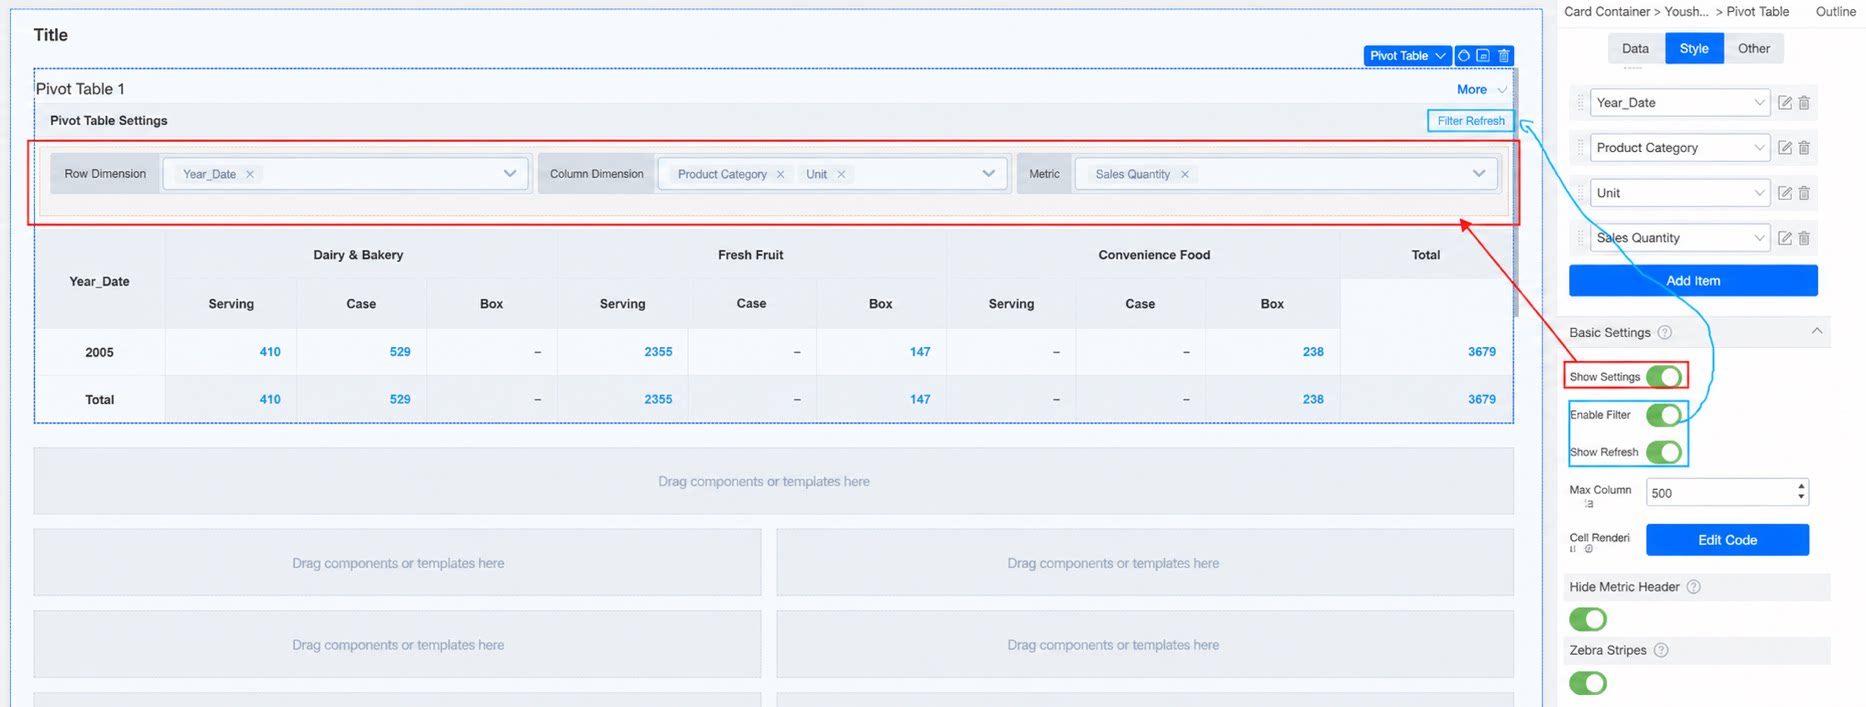
- The query filter of the cross table is configurable and displayed by default.
- The filter feature is not yet supported.
- The maximum number of columns is configurable.
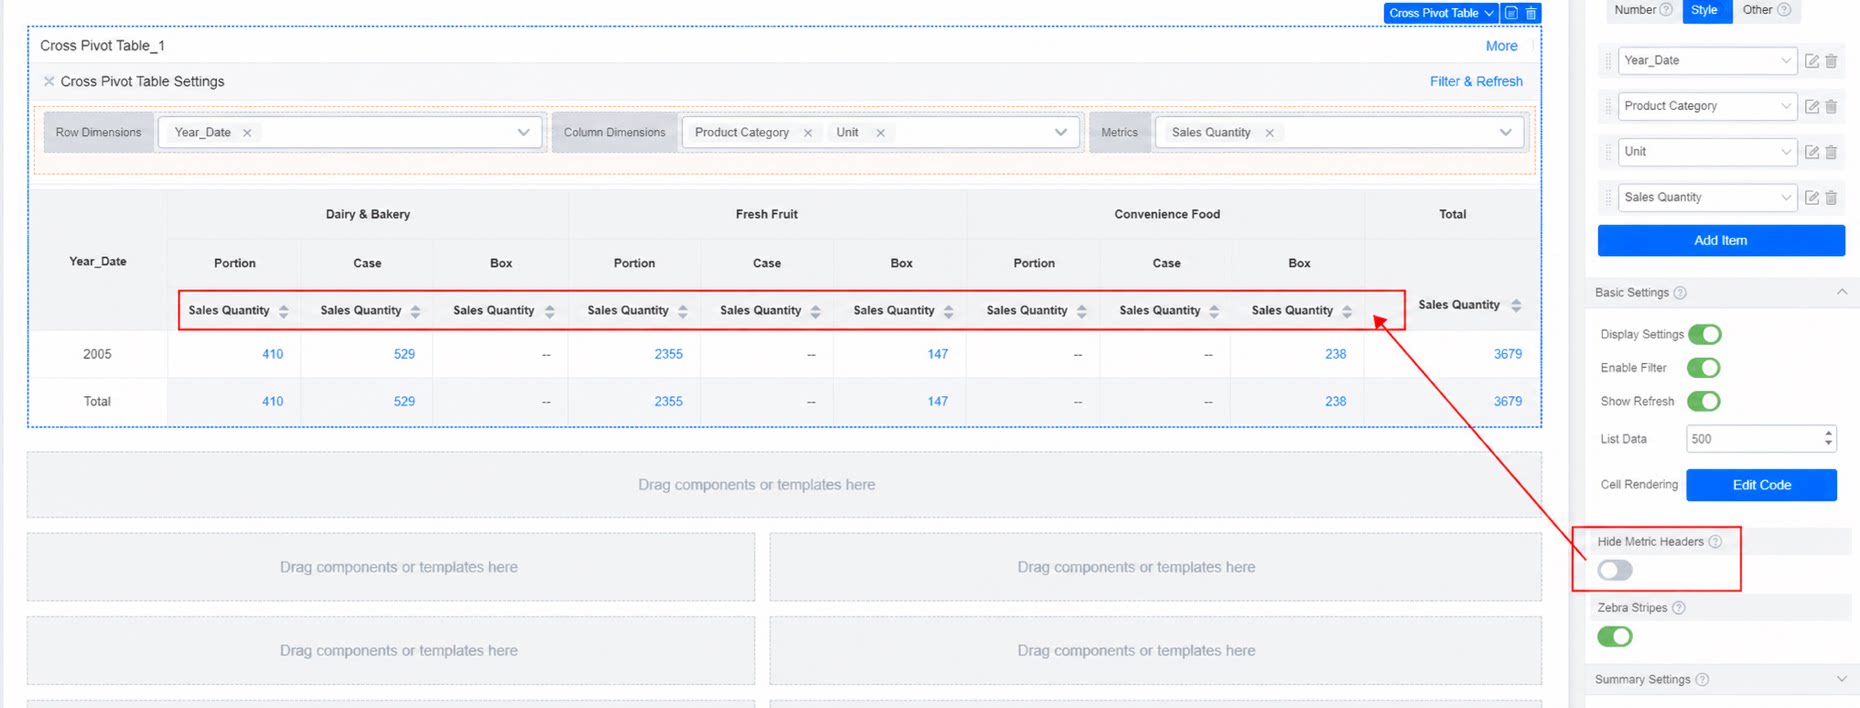
- The metric header can be shown or hidden.
- The zebra stripe style is enabled by default.
3.4 Summary Configuration
Row total: Enabled by default; can be turned off. Row total position: Configurable; defaults to the end. Column total: Enabled by default.4. Notes
- The maximum number of queried columns should not exceed 1,000; page rendering performance may degrade beyond that.
- The cross pivot table is non-paginated. Page rendering performance may degrade for tables with more than 2,000 data records.