Chats
Chats Calendar
 Meetings
 Contacts
 Mail
Mail Docs
Docs Drive
Drive AI Table
 AI Minutes
 Attendance
 Approval
 YiDA
YiDA Admin Console
Overview of the Report Page
The report designer consists of the right-side action bar, the component selection area, the page settings bar, and the canvas area. The canvas area contains the filter area, as shown below: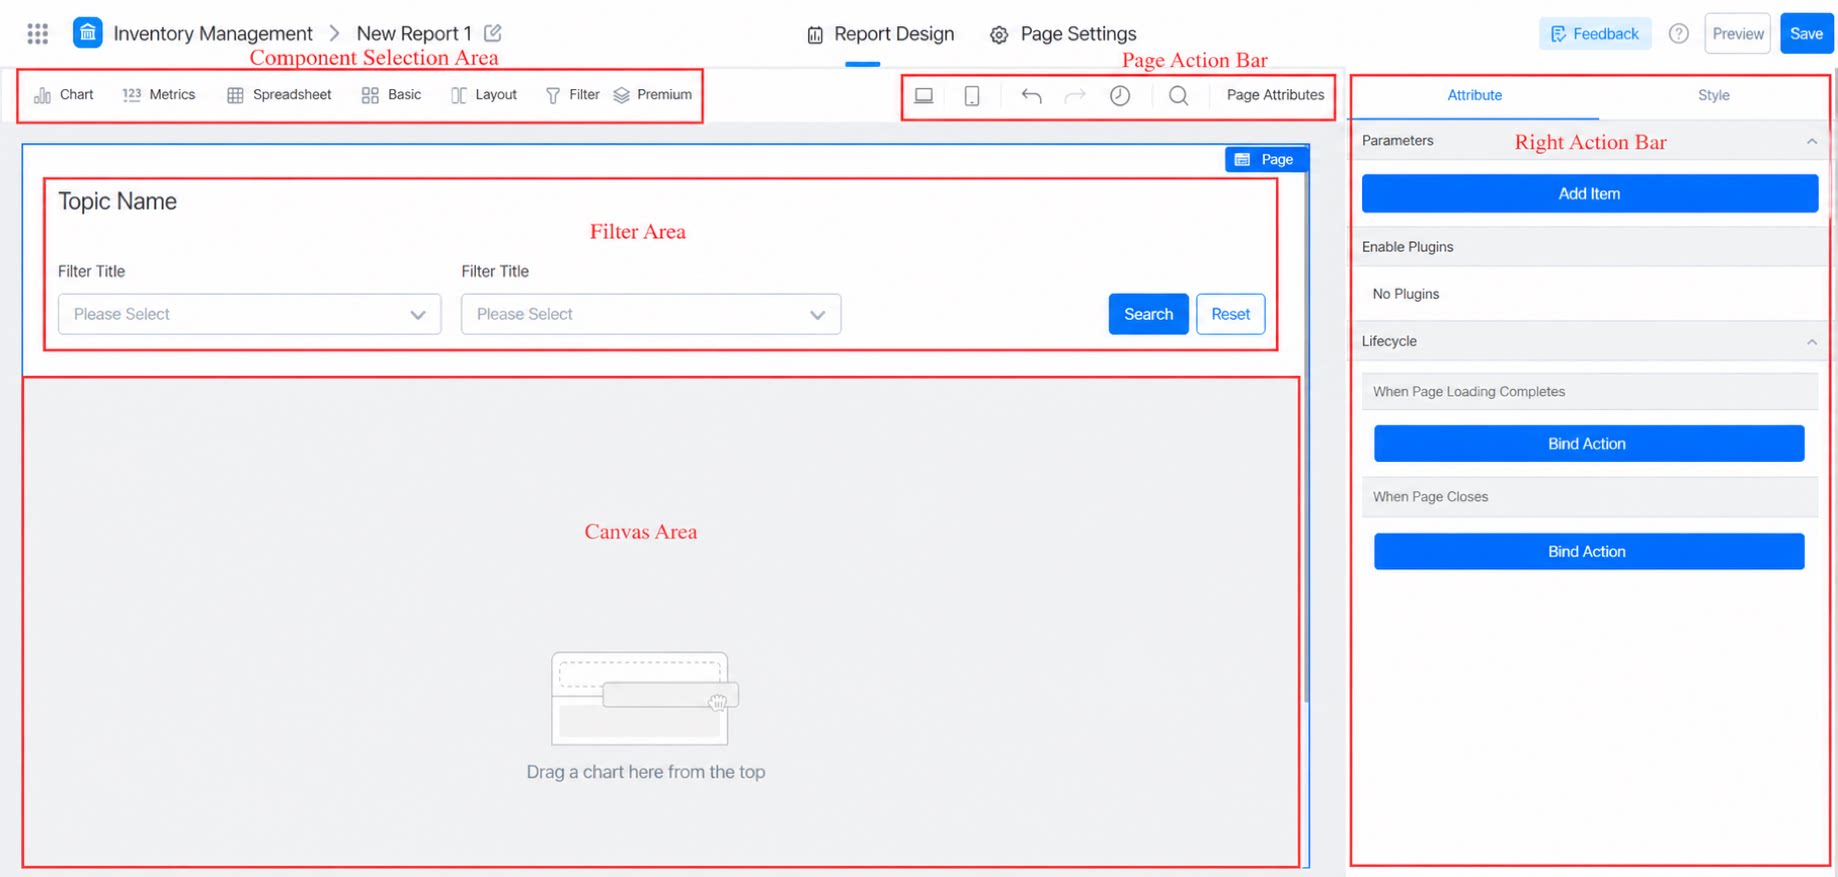
Page Settings Bar
Click Settings to configure the overall attributes of the report. You can configure actions to trigger when the page finishes loading or closes.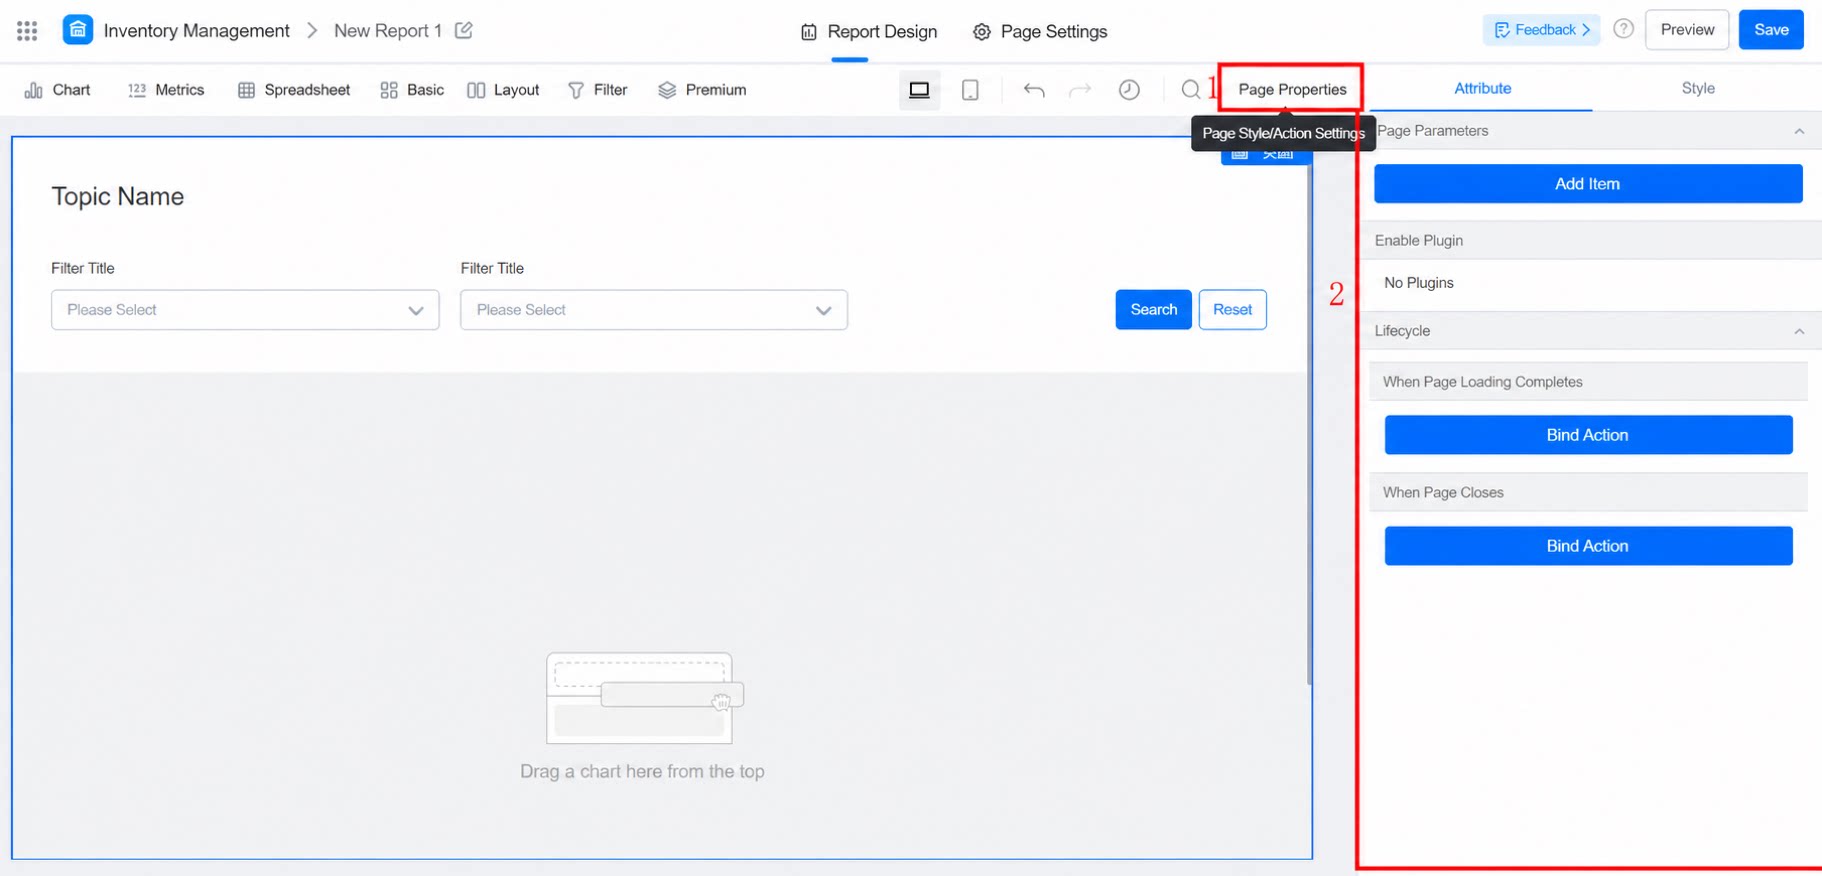
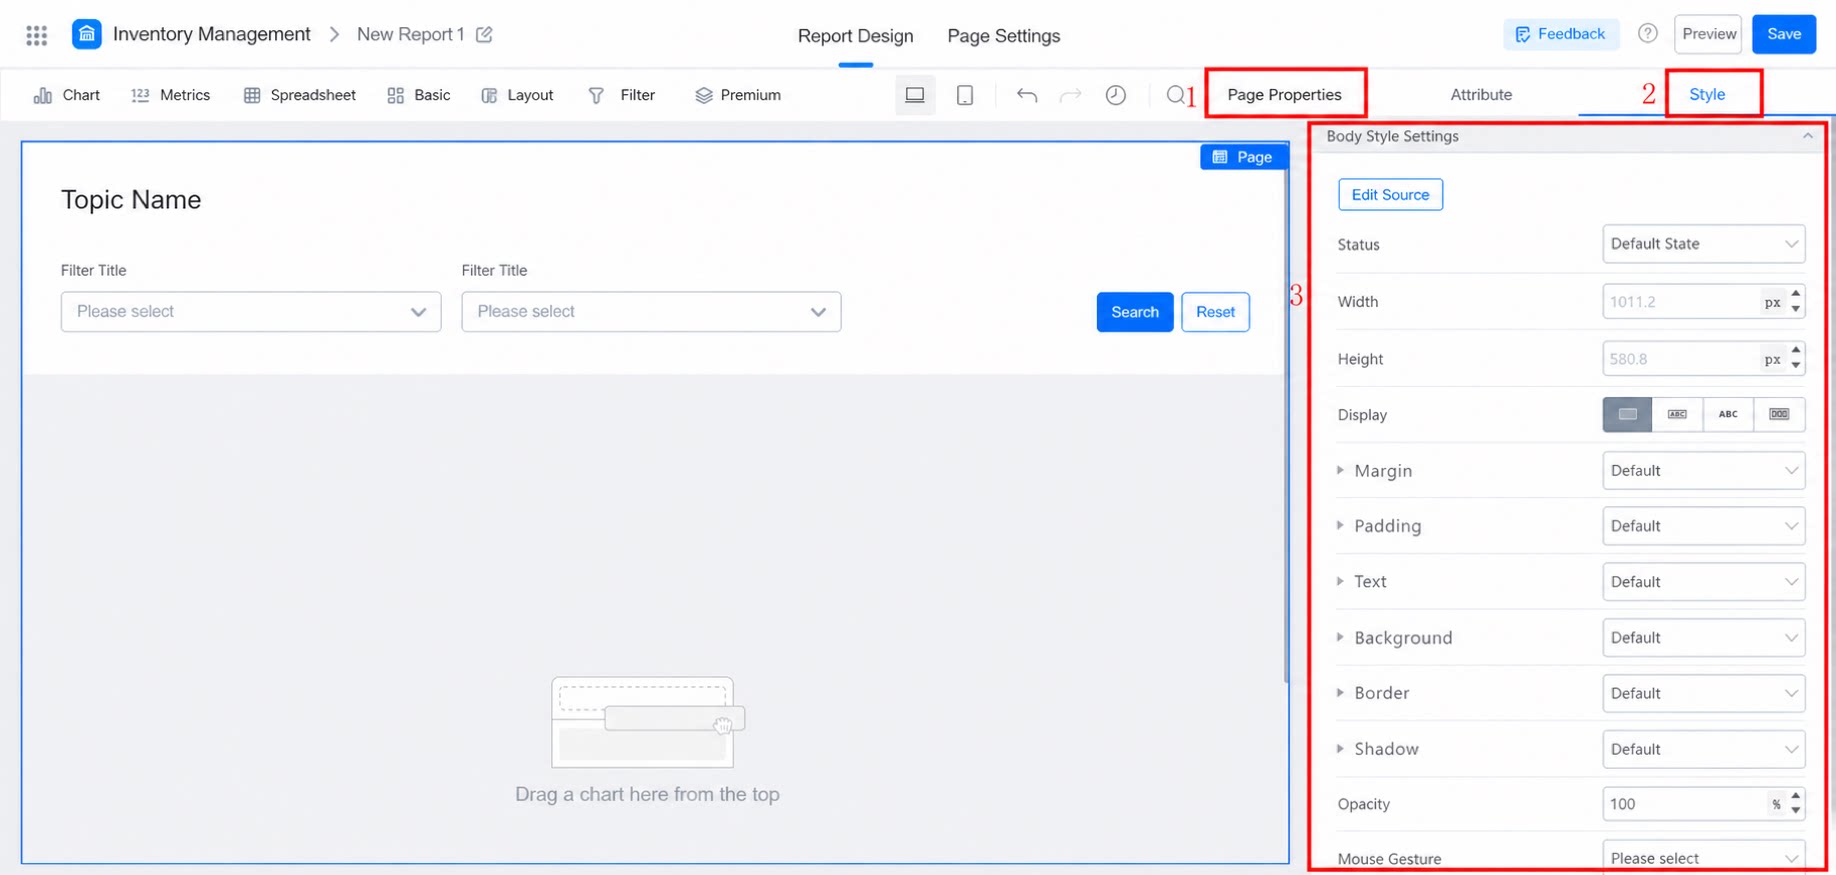
Component Selection Area
The report offers a variety of chart components. Select the components you need to display and analyze data.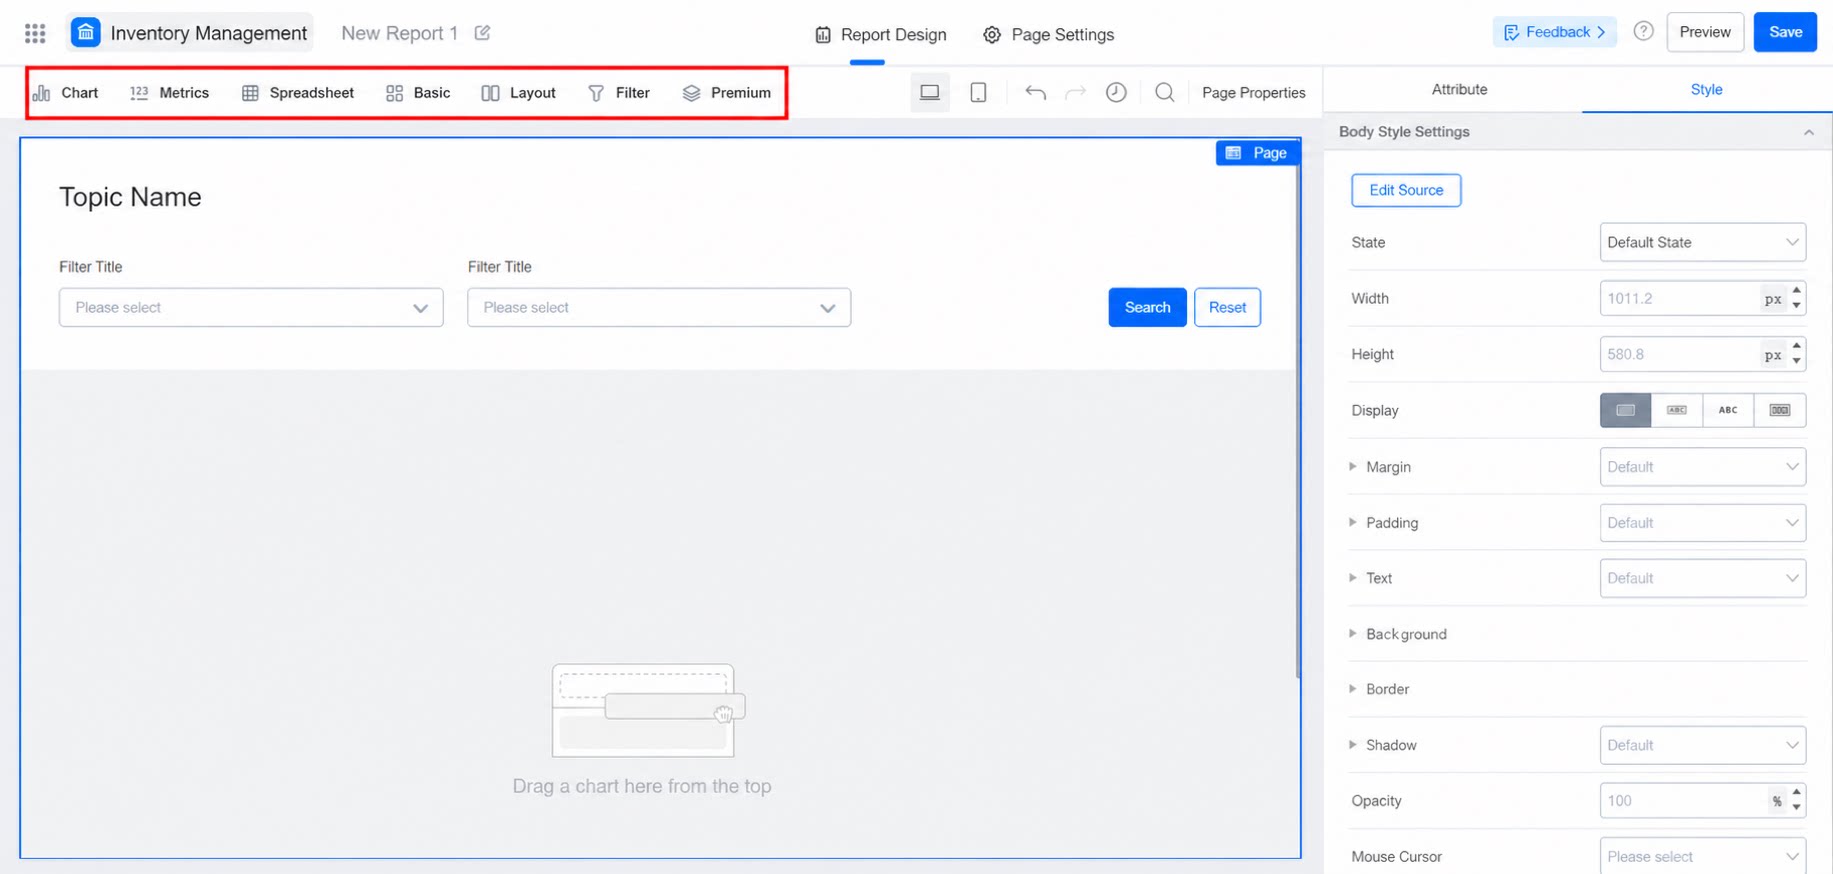
Filter Area
By default, the canvas area contains a filter component with a filter title. You can also add a dropdown filter or a time filter above it.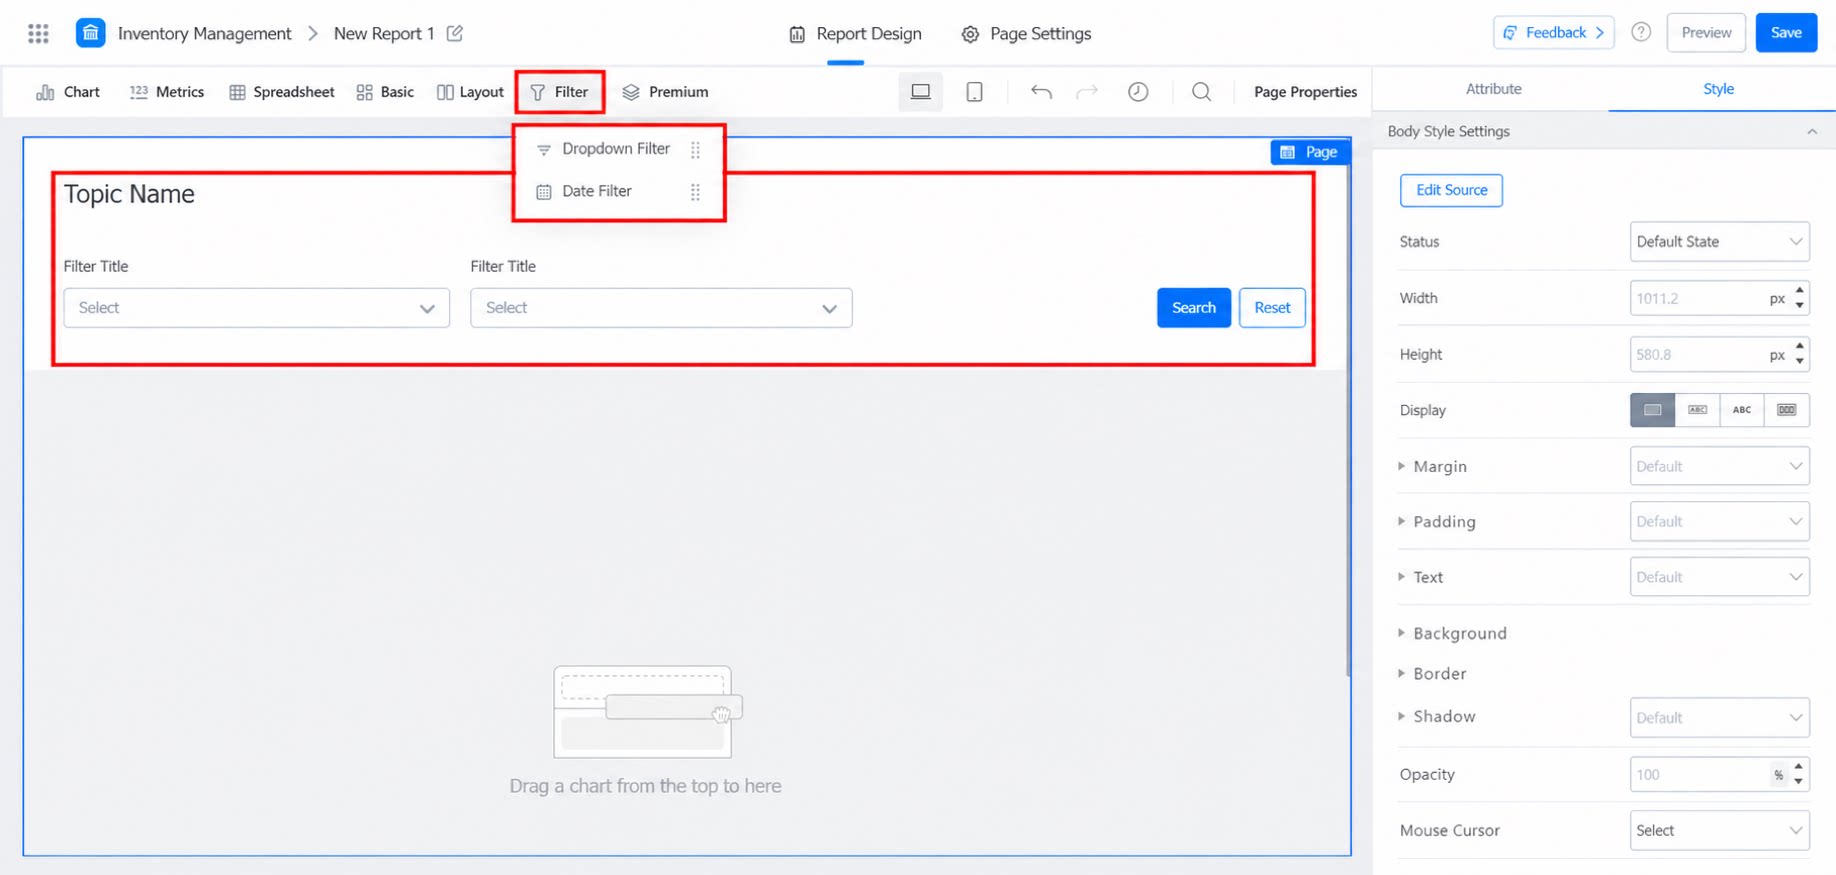
Right-Side Action Area
Use this area to configure the dataset, displayed data fields, and styles for the selected report component.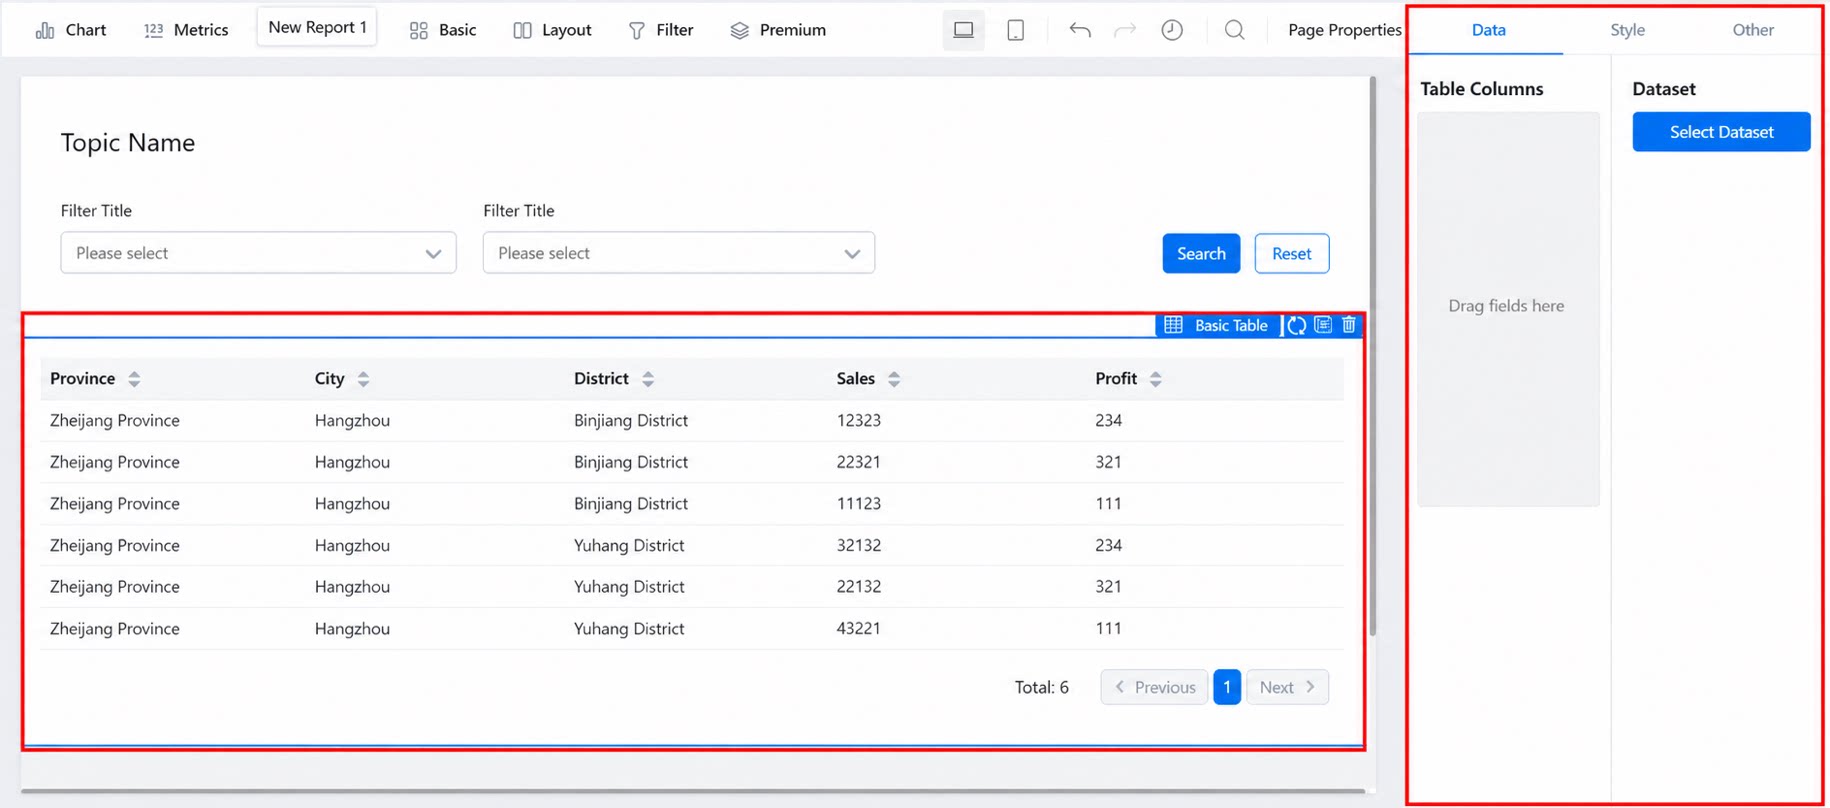
FAQ
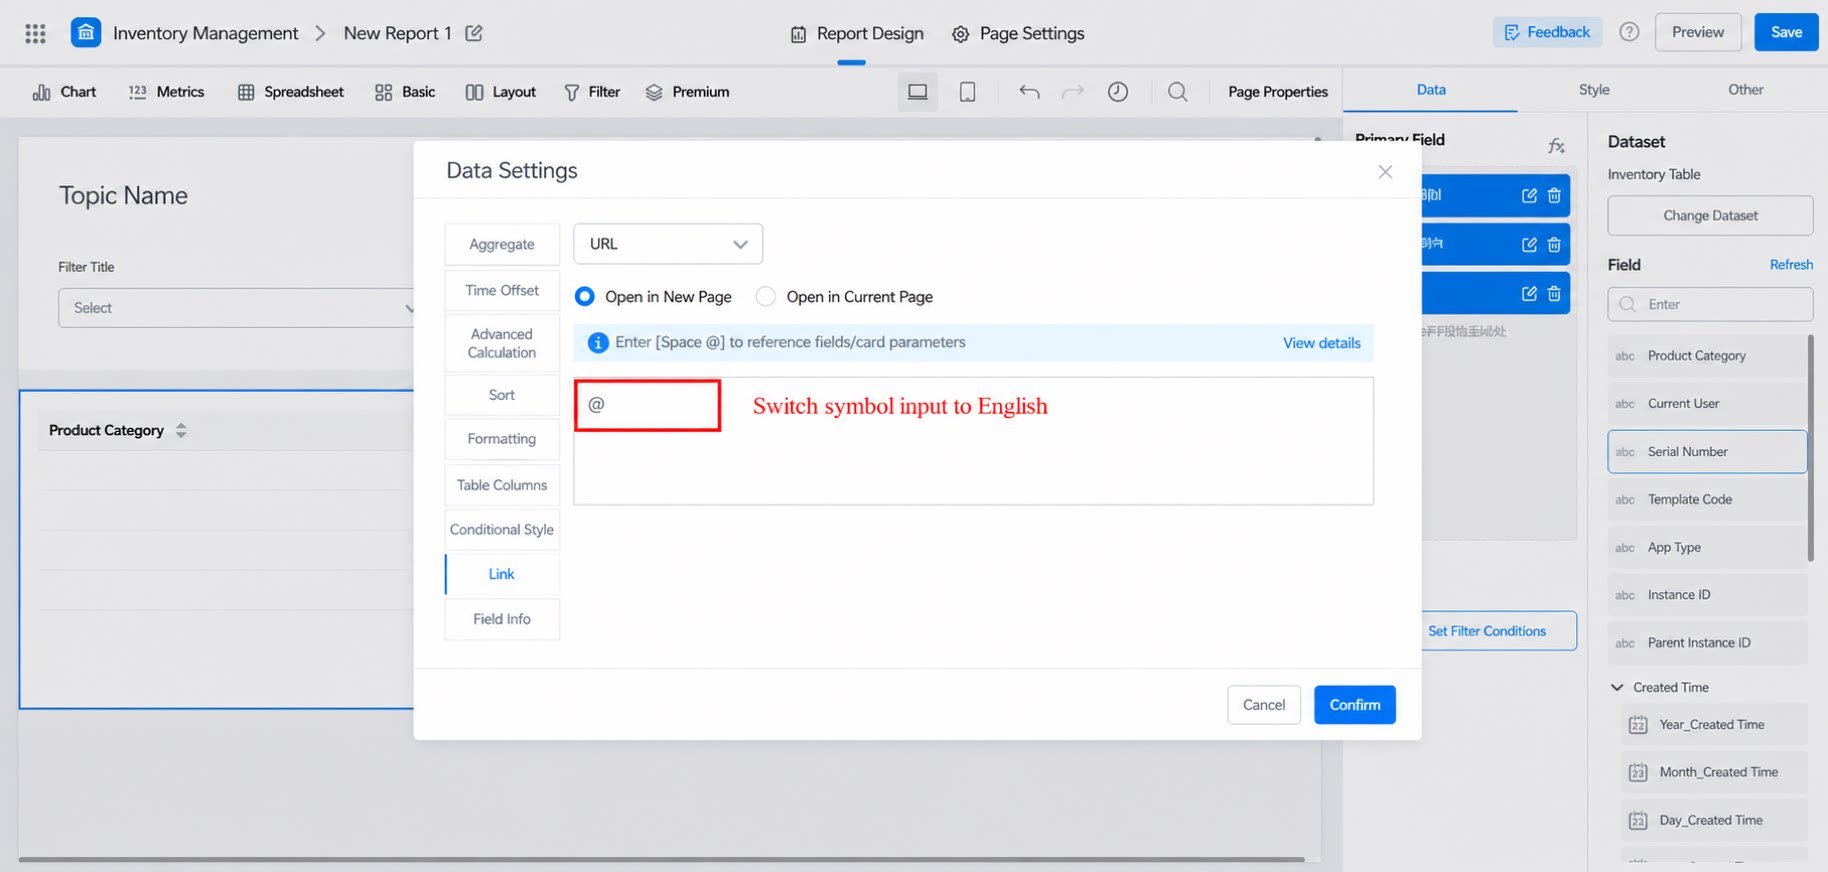
Why can't I select a field in the Link setting under Field data?
Why can't I select a field in the Link setting under Field data?
Enter the @ symbol in English (half-width) mode. Full-width Chinese symbols are not supported.
Using Tiles with Layout Components
By default, YiDA reports support tile dragging for each component, making it easy to instantly set the width, height, and position of charts. However, when using multiple layers of nested container components (such as tab pages, columns, or containers), turn off the tile switch on outer containers to improve page performance and the overall loading speed of the report.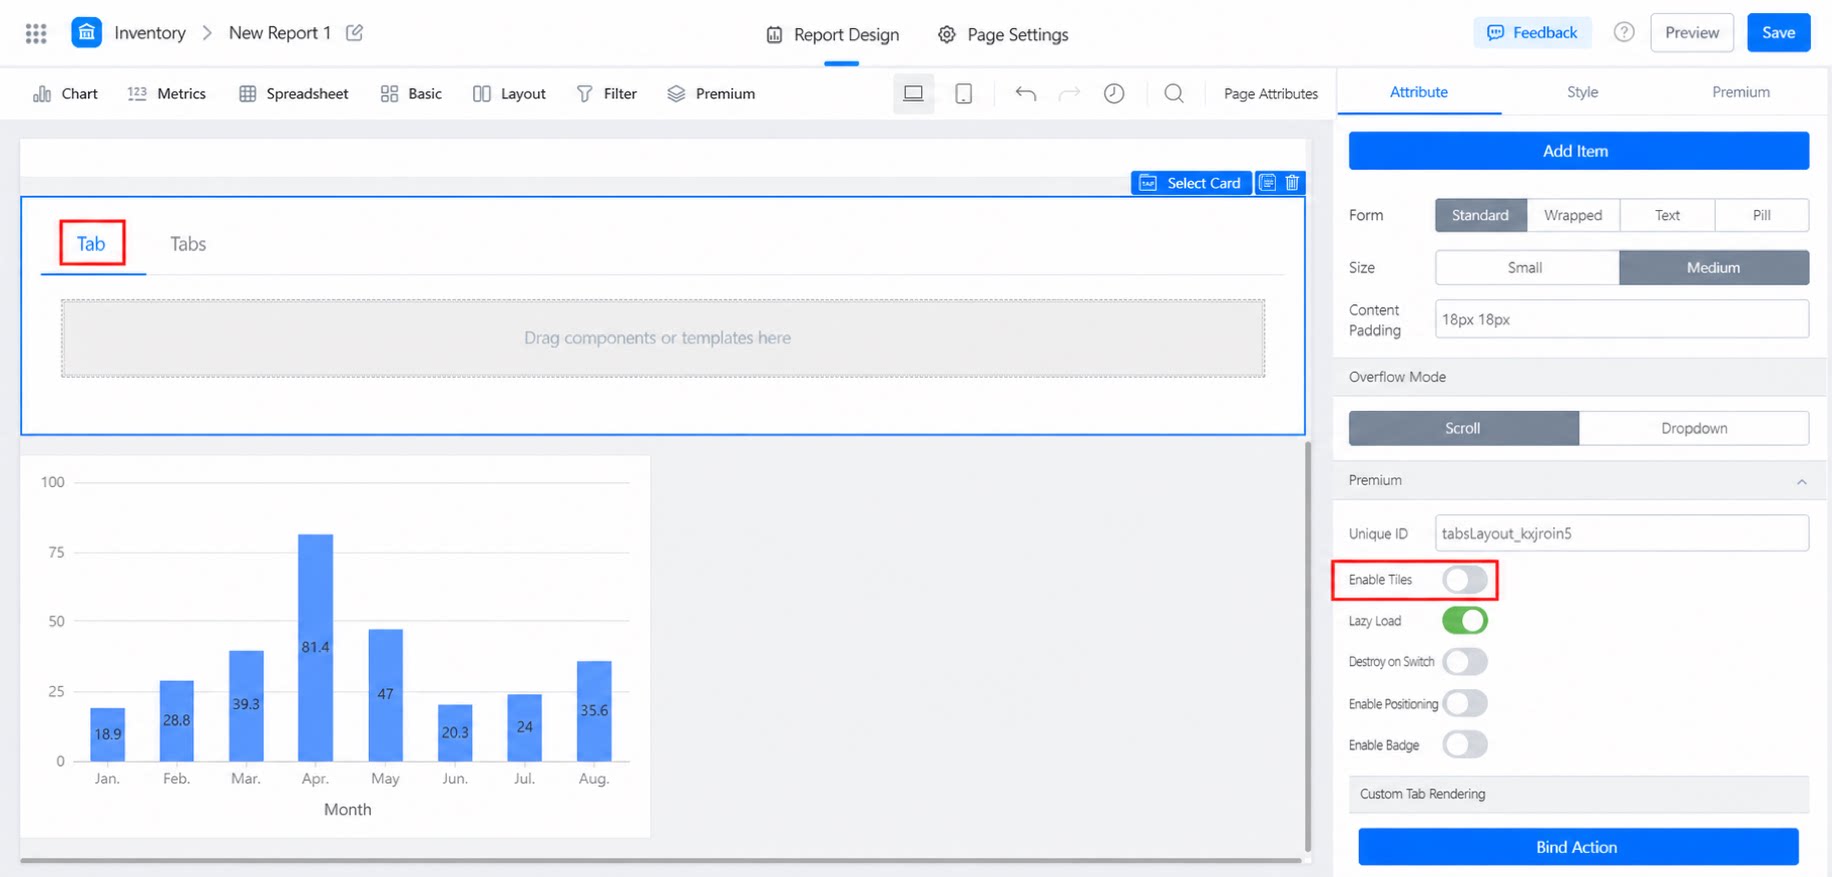
Can report charts and data cards be used interchangeably?
Can report charts and data cards be used interchangeably?
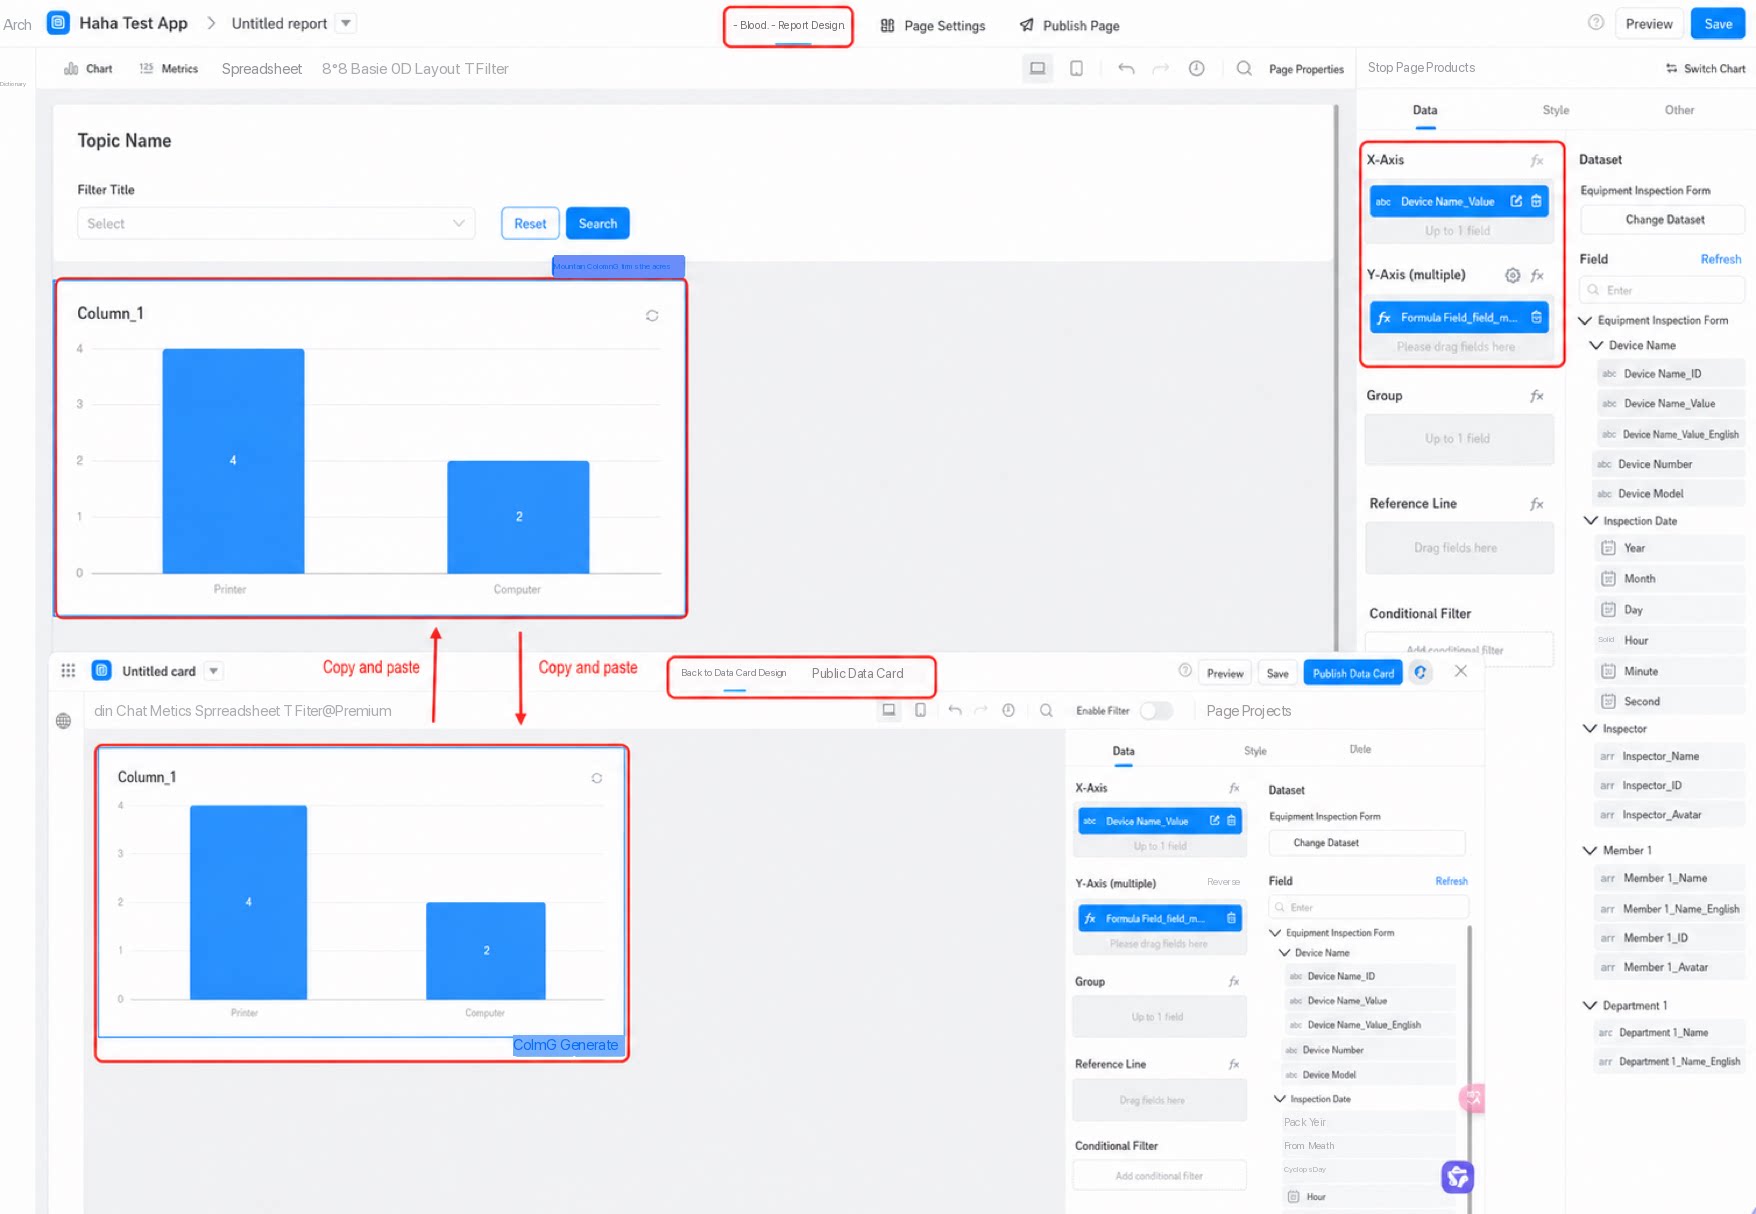
Yes. Copy and paste them: select the chart and press Ctrl+C, then go to the new page and press Ctrl+V, as shown below.