

 Chats
Chats Calendar
 Meetings
 Contacts
 Mail
Mail Docs
Docs Drive
Drive AI Table
 AI Minutes
 Attendance
 Approval
 YiDA
YiDA Admin Console
Introduction to report components for chart types.
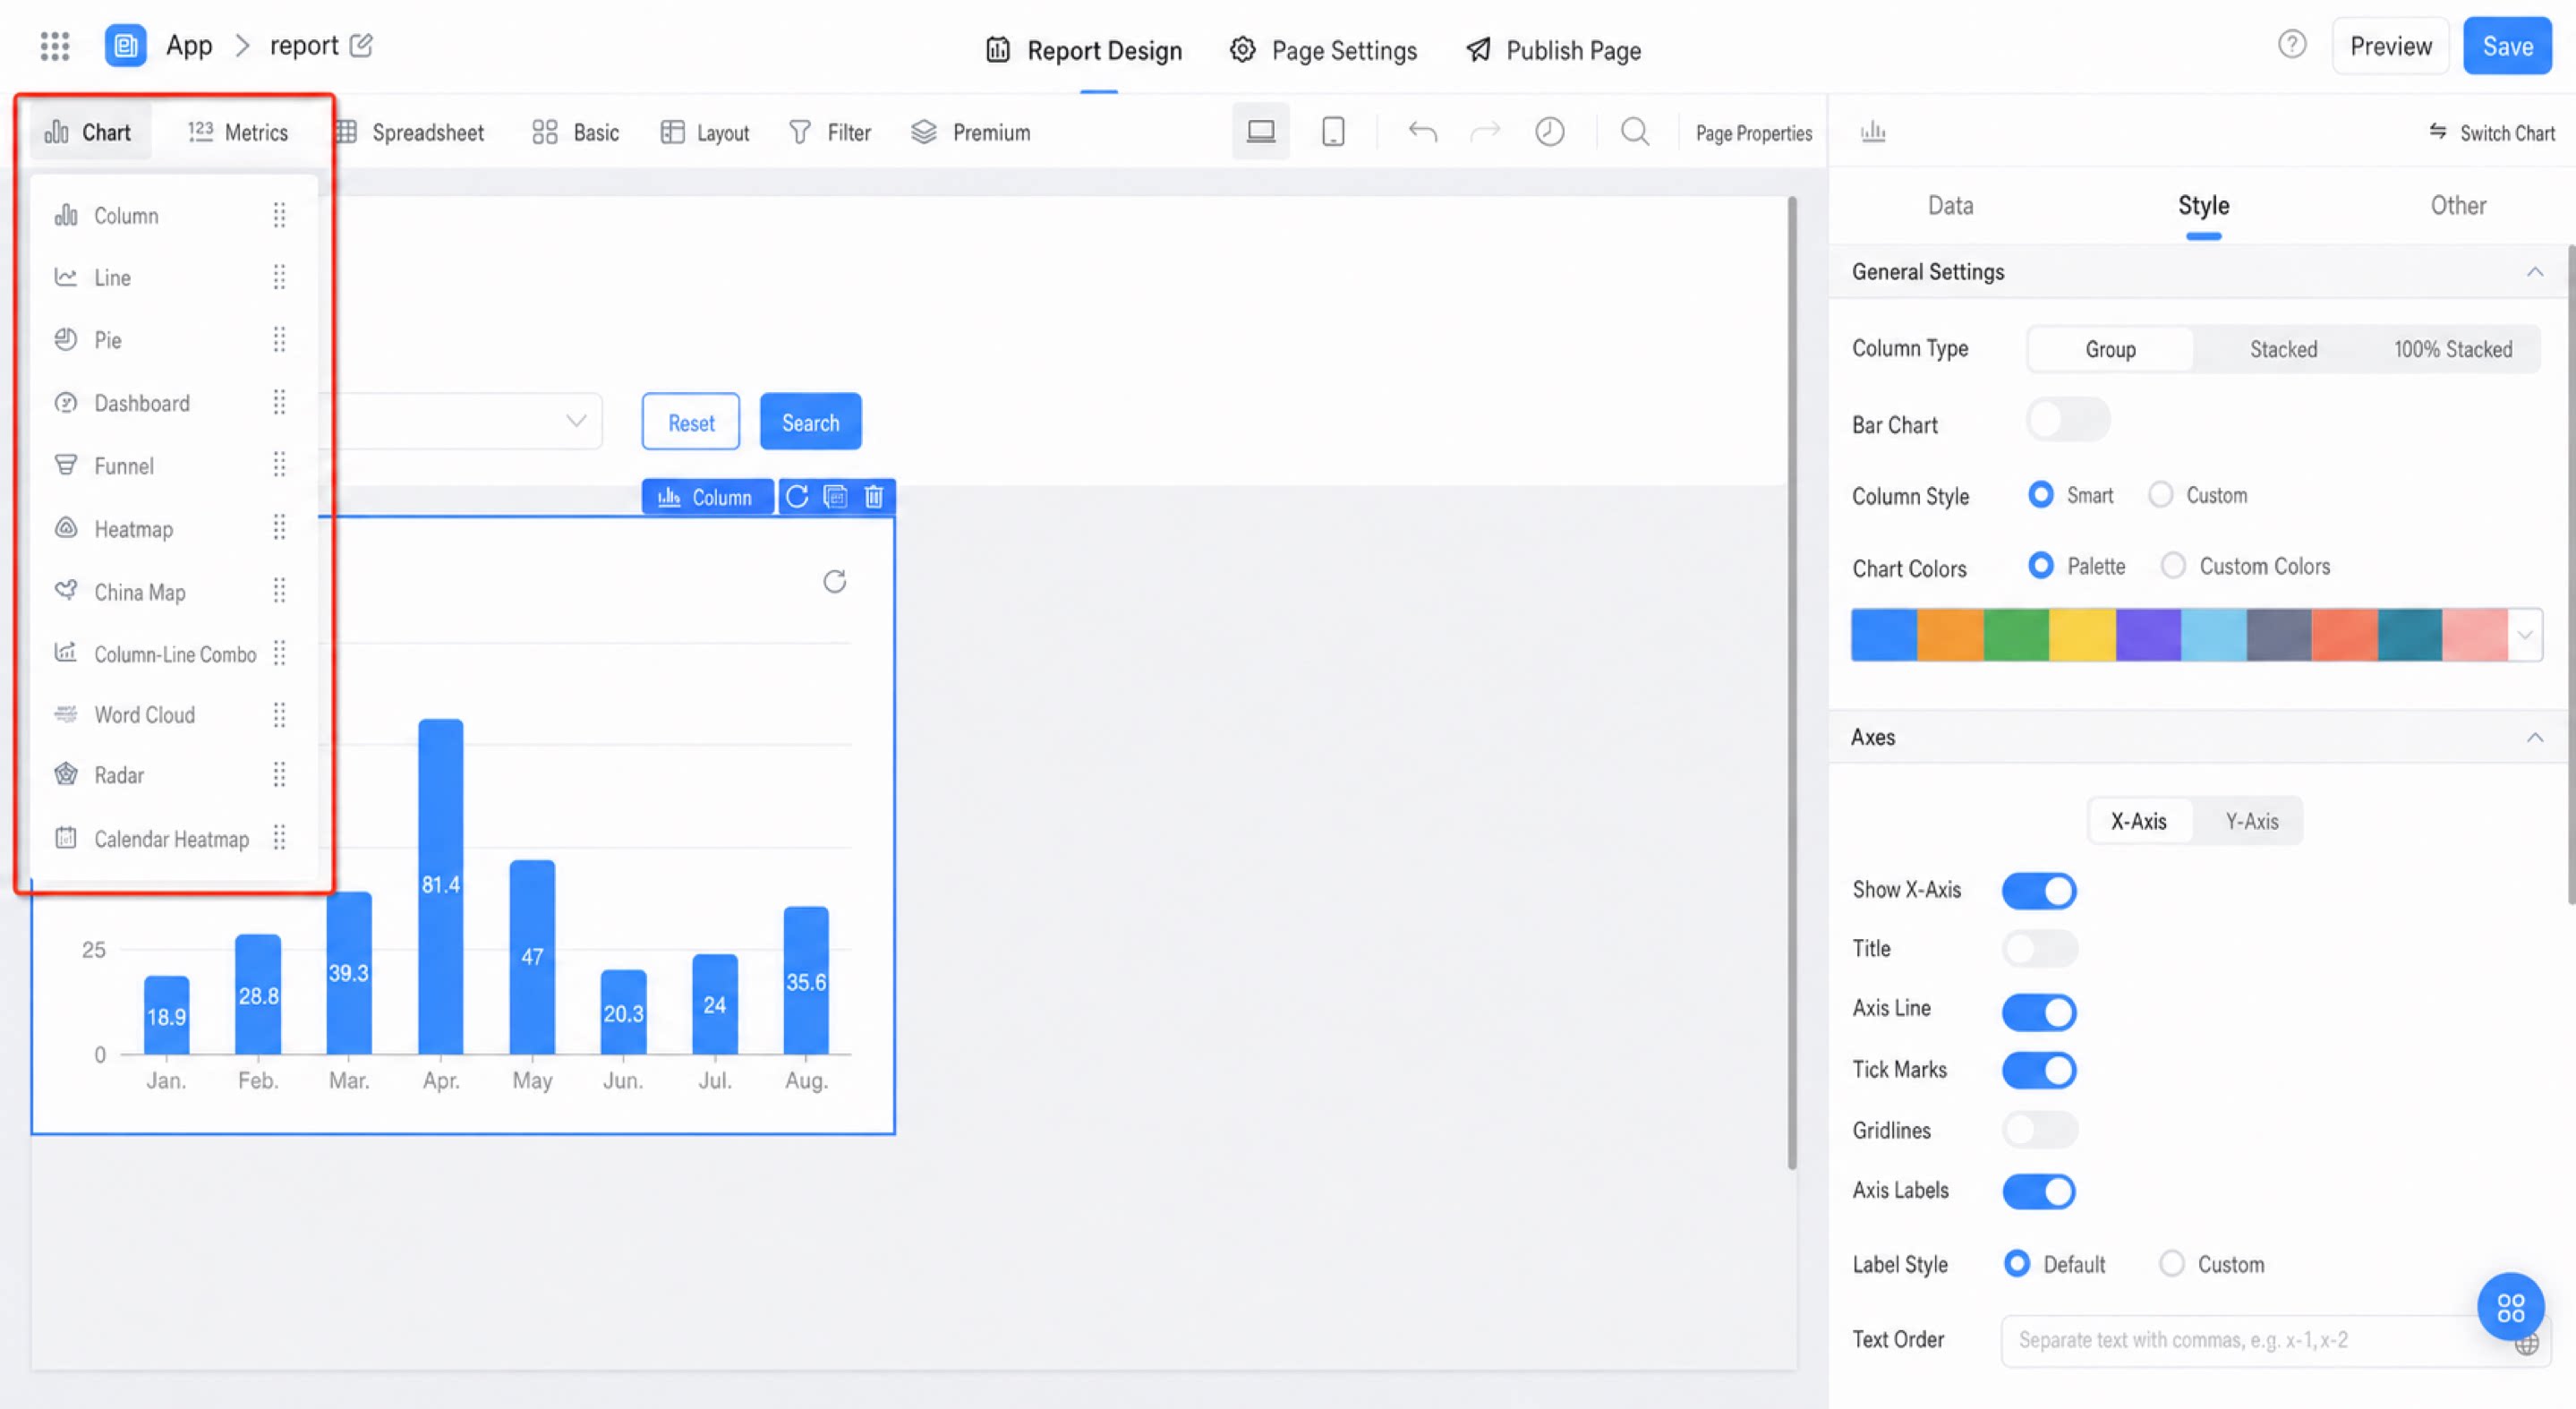
- Column
- Line
- Pie
- Gauge
- Funnel
- Heatmap
- China map
- Column-line combination
- Word cloud
- Radar
- Calendar heatmap
Introduction to report components for various chart types, including Column, Line, and Pie, for data analysis and visualization.
Introduction to report components for chart types.