Chats
Chats Calendar
 Meetings
 Contacts
 Mail
Mail Docs
Docs Drive
Drive AI Table
 AI Minutes
 Attendance
 Approval
 YiDA
YiDA Admin Console
1. Introduction
1.1 Feature Overview
With the table component, you can display your data and flexibly adjust its style.1.2 Use Cases
Suitable for scenarios such as displaying warehouse product names and inventory quantities, or student exam scores.1.3 Basic Requirements
The basic requirements for the table are as follows:
Note: Up to 500,000 records can be exported.
2. Steps
2.1 Select the Component and Configure the Dataset
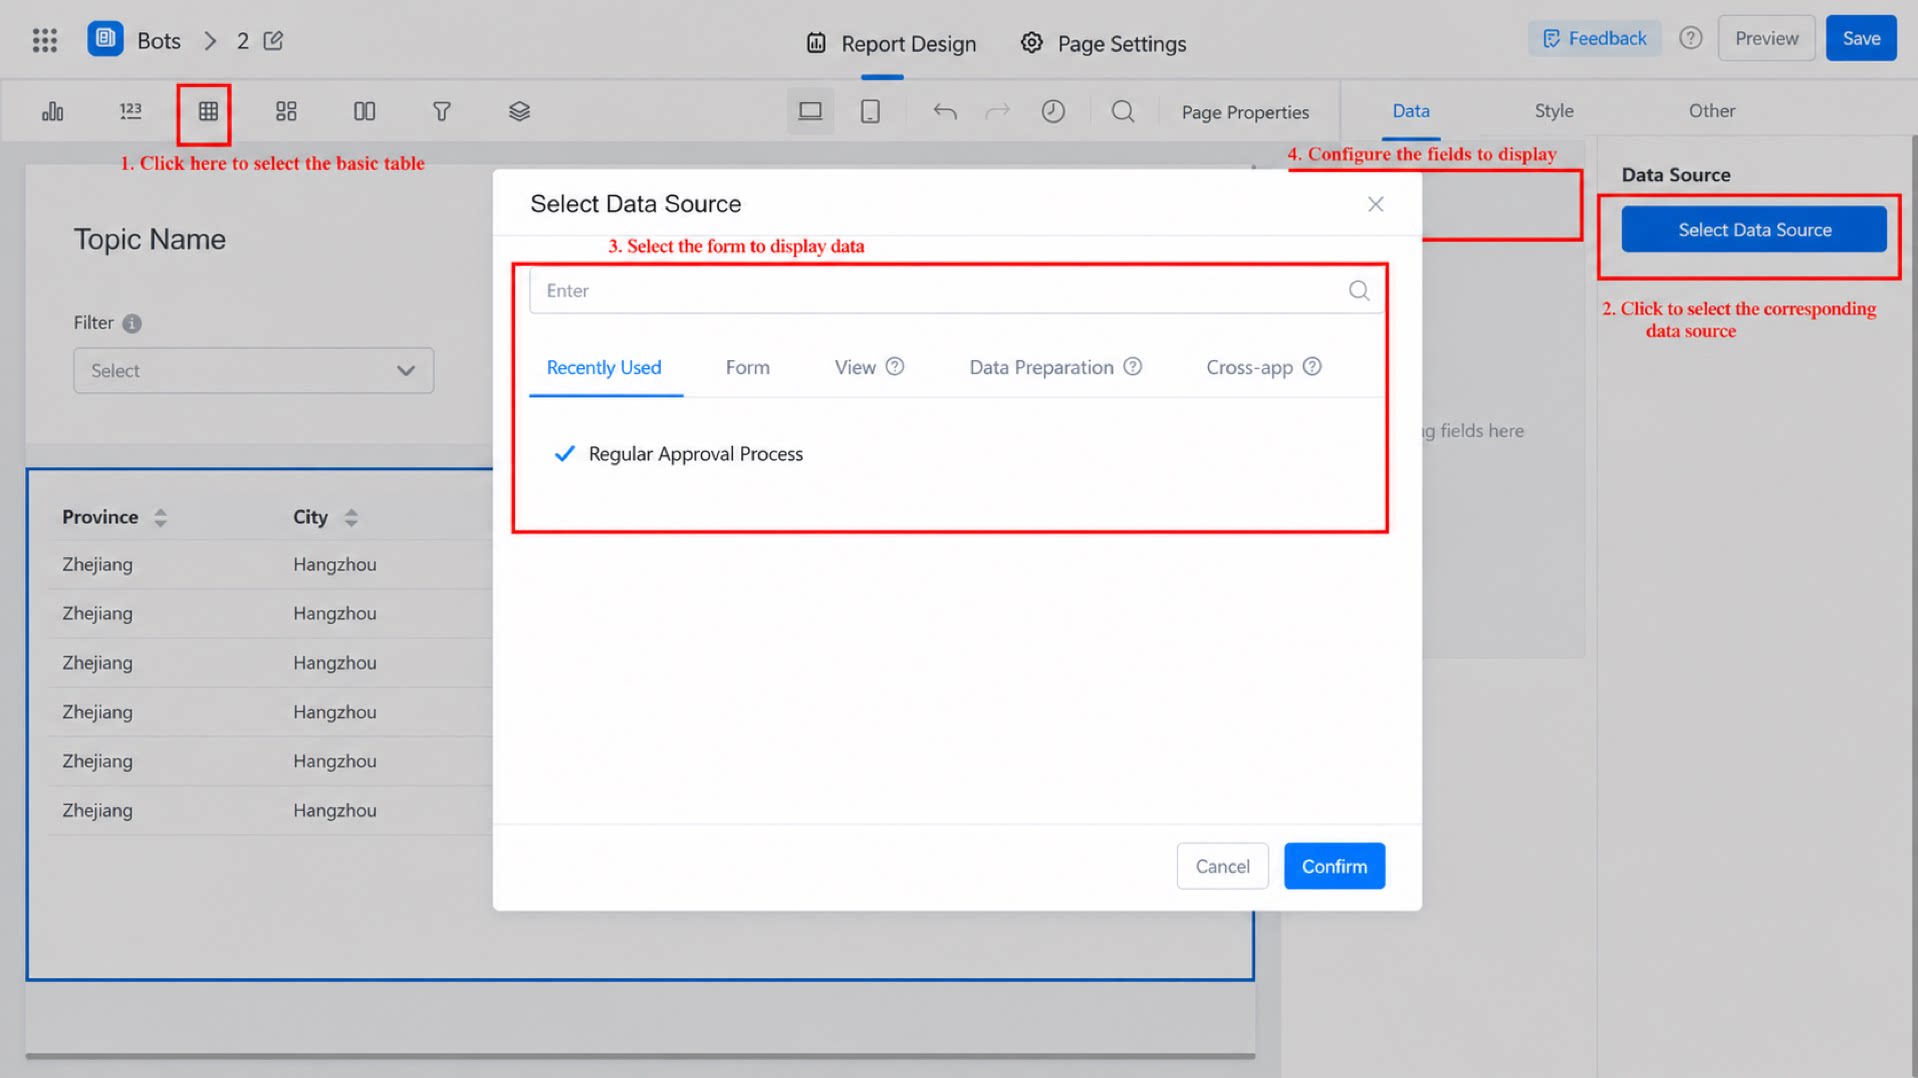
2.2 Select the Fields to Display in the Chart
In the field panel on the right, drag the corresponding data into the table columns. You can select fields directly from the dataset or generate them using formulas. For details on formula usage, see Report formulas.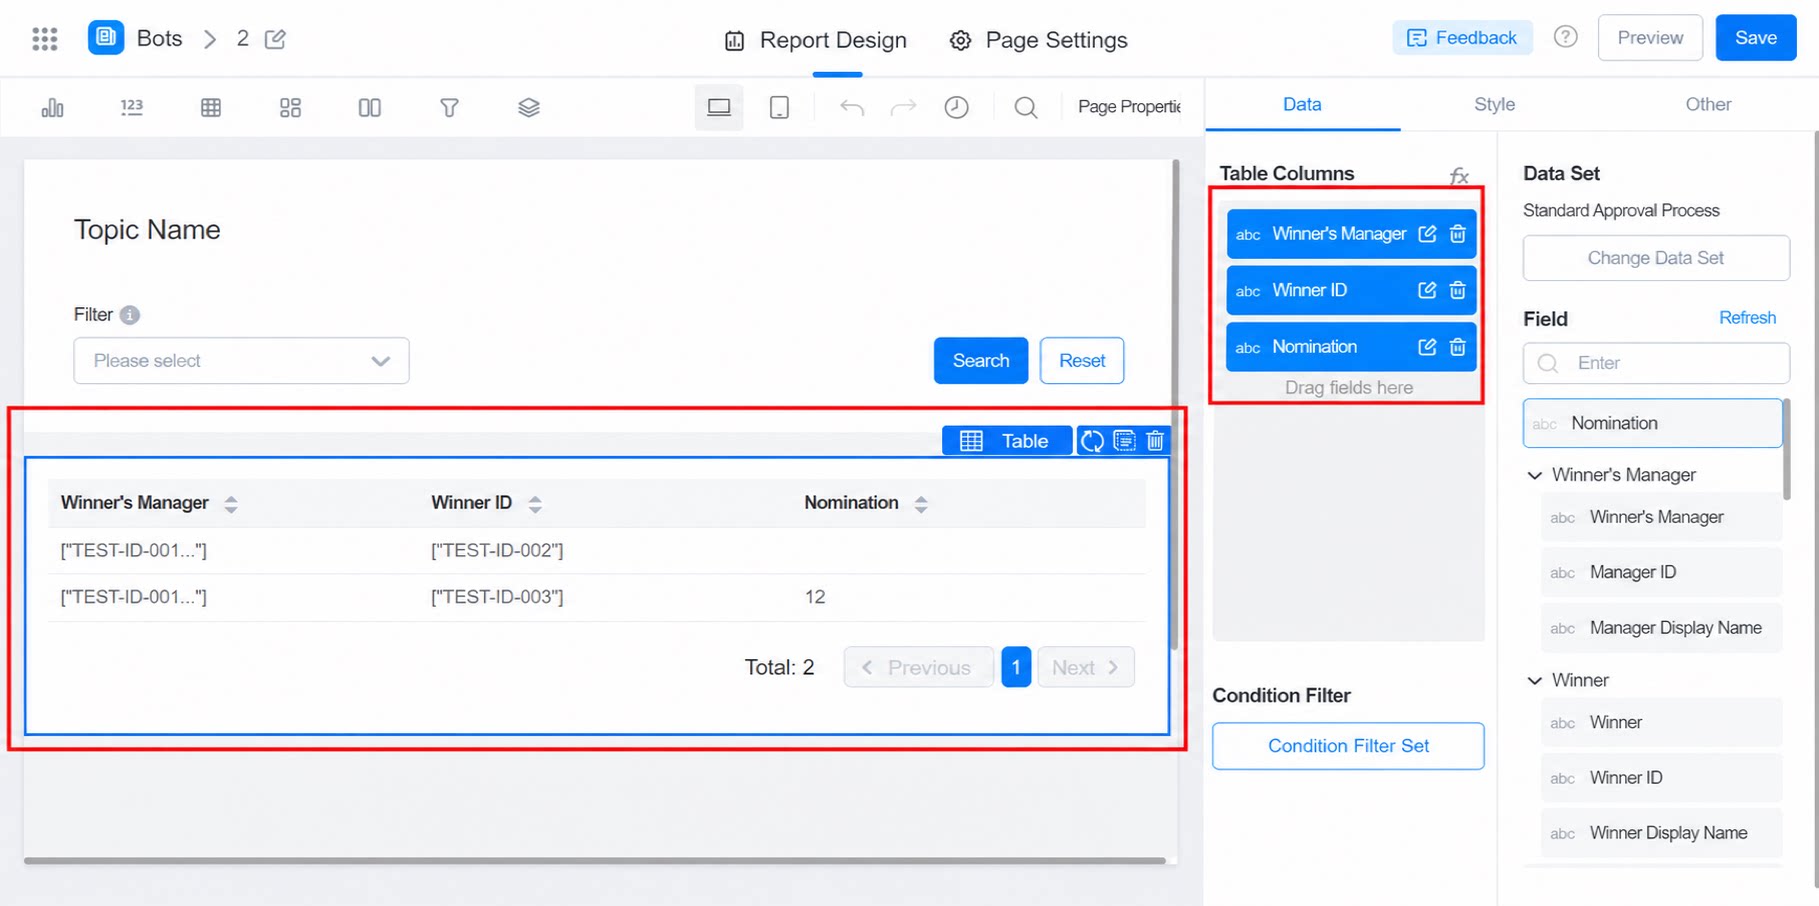
2.3 Style Settings
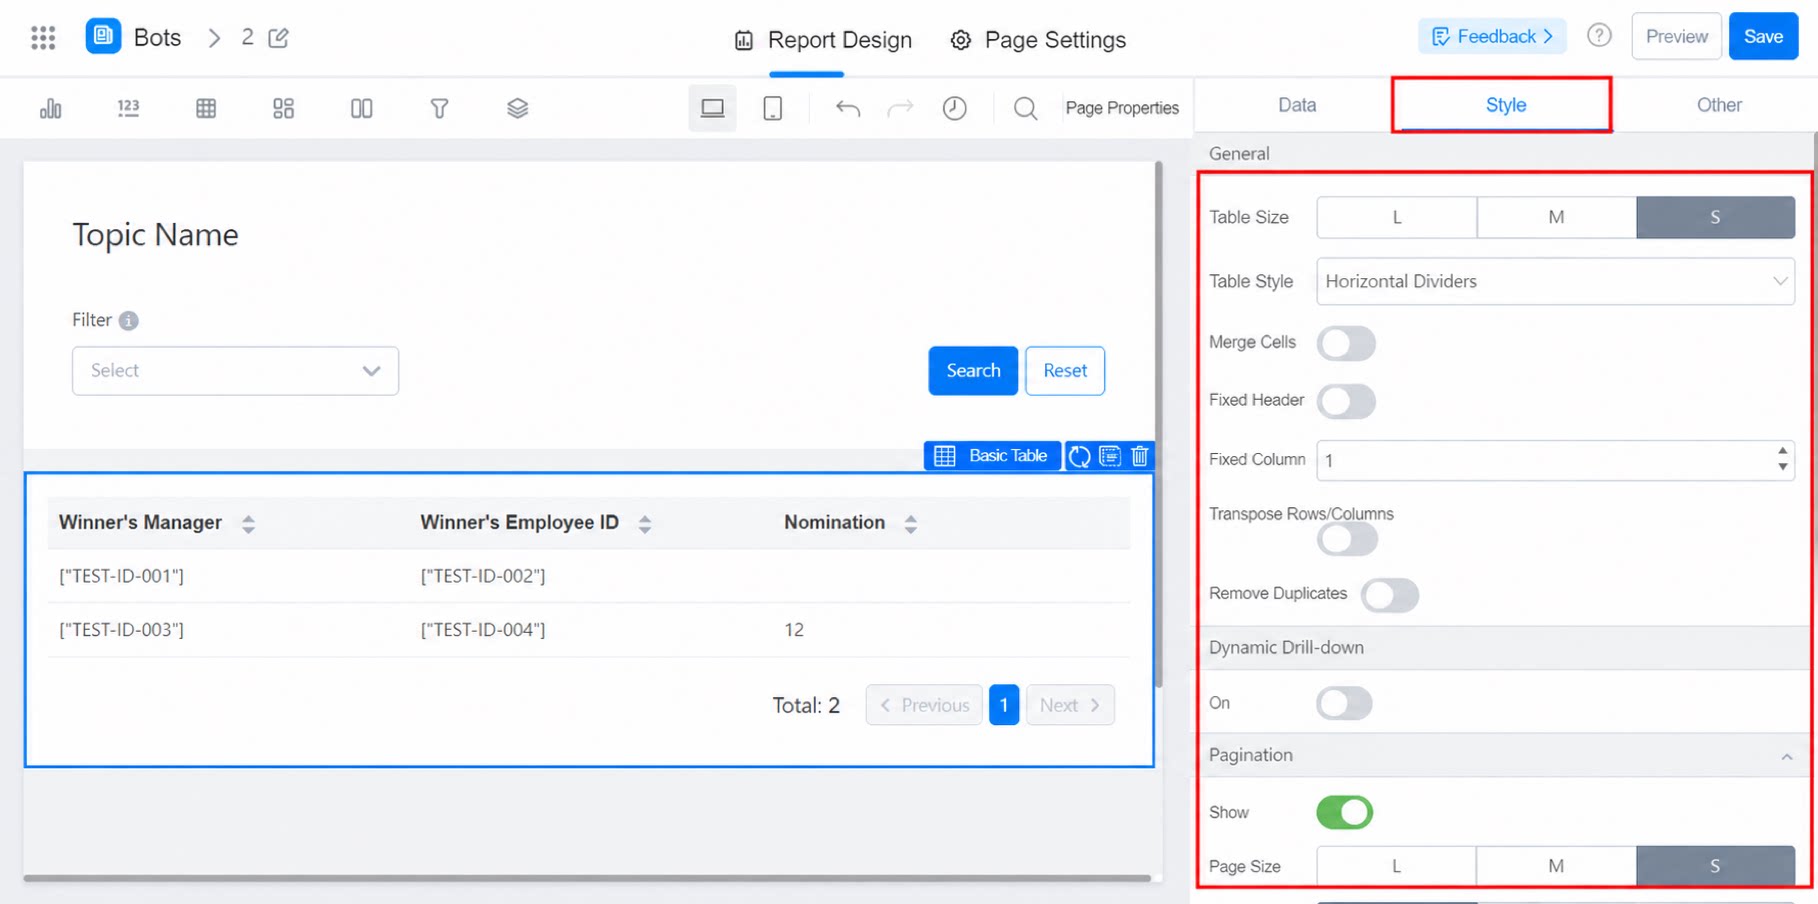
2.3.1 Overall Configuration
Table size: The overall size of the table. Table style: The border style. Options include No border, Zebra stripes, Horizontal divider, and Border. Merge Cells: When enabled, cells are merged starting from the first column until no more duplicate values remain across all columns. Before merging, we recommend sorting the data in the data field settings panel to prevent identical values from being separated and left unmerged. Fixed header: When enabled, the header remains visible at all times (for example, it is still shown when a user has no Data Permissions). Transpose rows and columns: When enabled, data is displayed with rows and columns swapped. You can then set the background of the first row. Dynamic drill-down, row numbers, and similar configurations are not supported in this mode. Deduplicate: When enabled, duplicate data is automatically removed.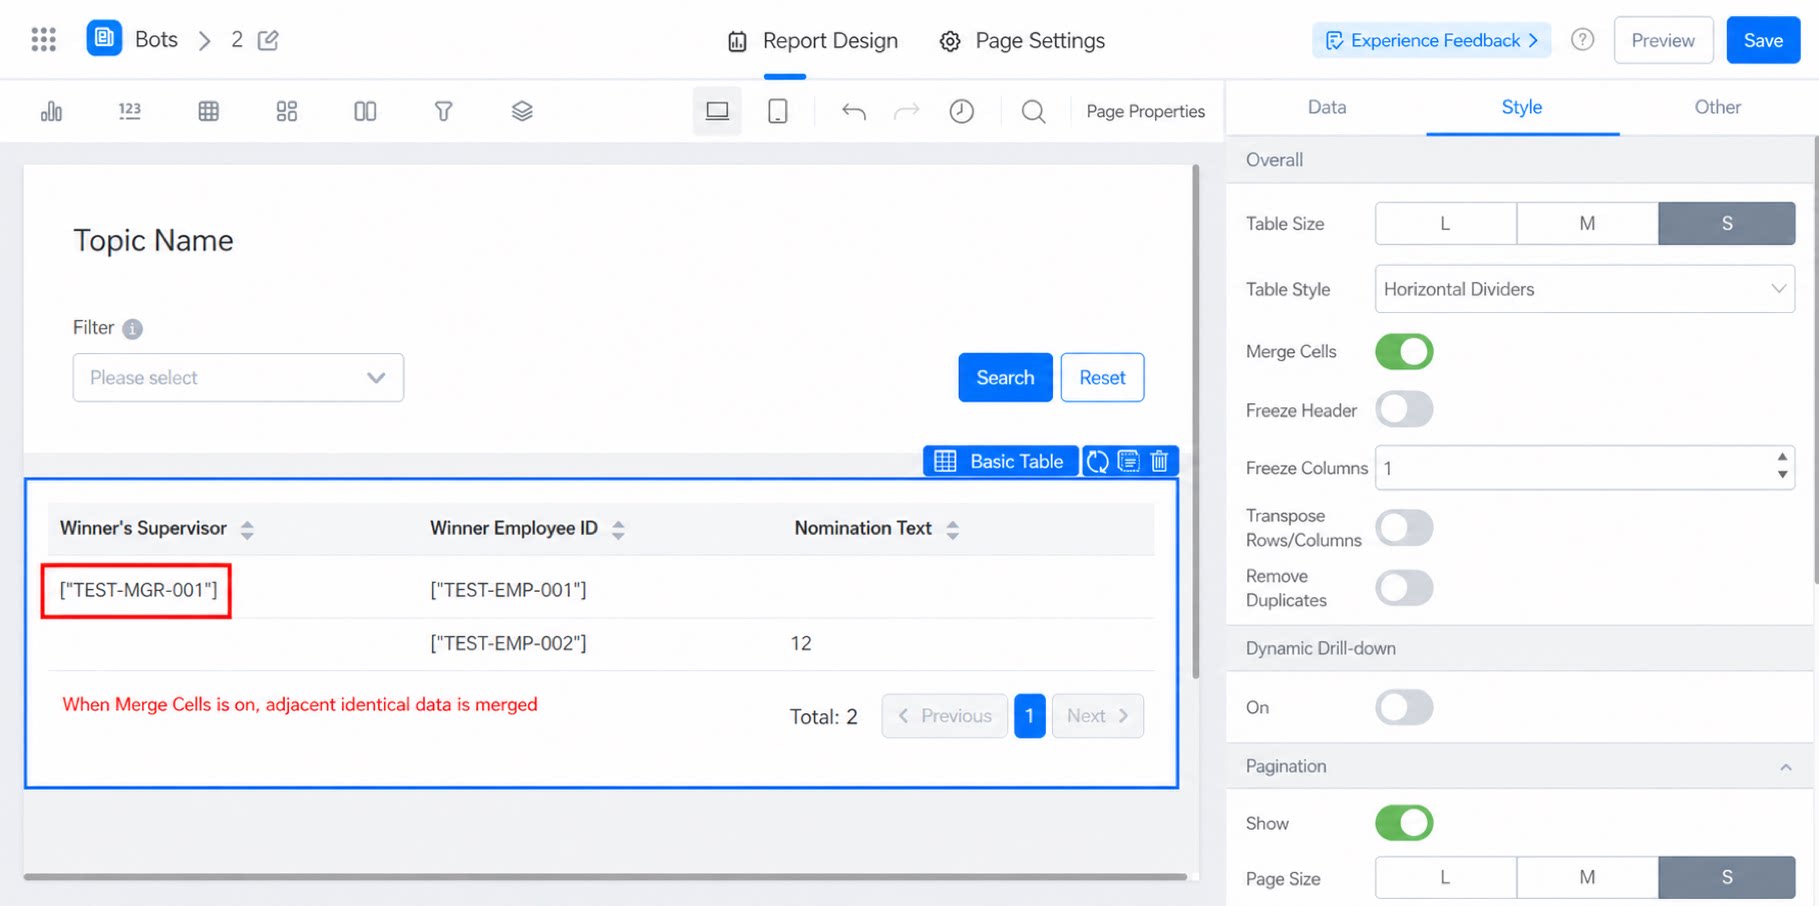
2.4 Dynamic Drill-Down
Dynamic drill-down is a special drill-down mode designed for expanding tree-structured data. Unlike regular drill-down, with dynamic drill-down the number of levels under each node is unknown in advance. For example: Under [Finance Headquarters], there are first-level departments [Finance Dept 1] and [Finance Dept 2]. Finance Dept 1 has a second-level sub-department [Dept 1 sub-department], but Finance Dept 2 does not. In this case, use dynamic drill-down to achieve dynamic expansion, as shown below: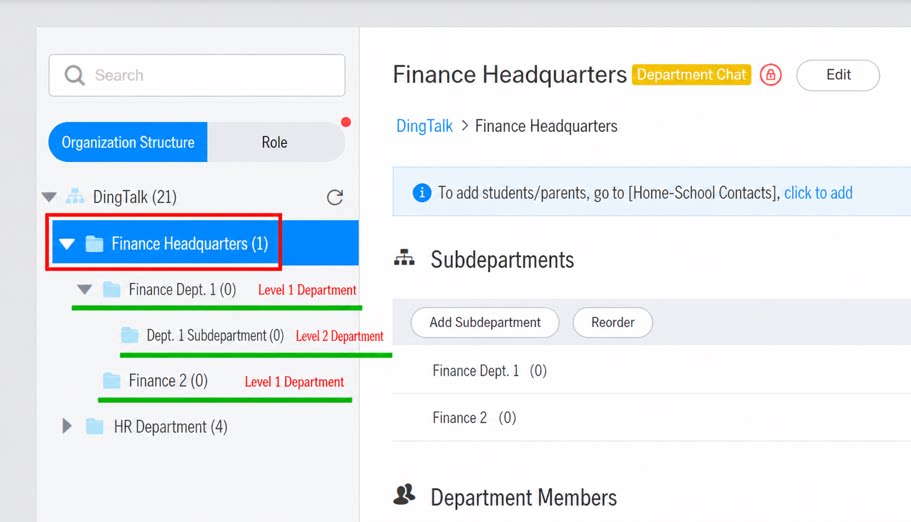
2.4.1 Prepare Data
Follow the format below. You must provide id, parentid, and whether the node is a leaf node.- Department 1-1 and 1-2 are sub-departments of Department 1, so their parentid is the id of Department 1. Note that ids must be unique.
- If a department is a root node (a top-level department), mark it as root.
- For the leaf node indicator, use 1 for yes and 0 for no.
2.4.2 Configuration
Node id: For example, the department name. Parent node id: For example, the parent department name. For a root node, set it to root. Leaf node: 1 for a leaf node, 0 for a non-leaf node. Drill-down filter: The data range for drill-down data. Once configured, drill-down fields are controlled by this filter range. If not configured, they are controlled by Data Permissions. We recommend keeping it consistent with the table’s filter conditions and removing any filter conditions related to the Node id and Parent node id you configured.- If your id and parentid are [Department name] and [Parent department name], and the table has a filter condition [Department name] = Finance Headquarters, you do not need to configure this filter here, because you have already used [Department name] as the id.
- If you have configured a filter outside the table, such as [Department name] = Finance Headquarters AND [Tenure] > 10, you must configure [Tenure] > 10 here. Otherwise, employees of all tenures will be counted.
2.5 Pagination
Pagination settings include Page size, Pagination style, Number of page numbers, Records per page, and Page switching.- Number of page numbers: The maximum number of page numbers displayed in the paginator.
- Records per page: The number of records displayed per page.
2.6 Row Numbers
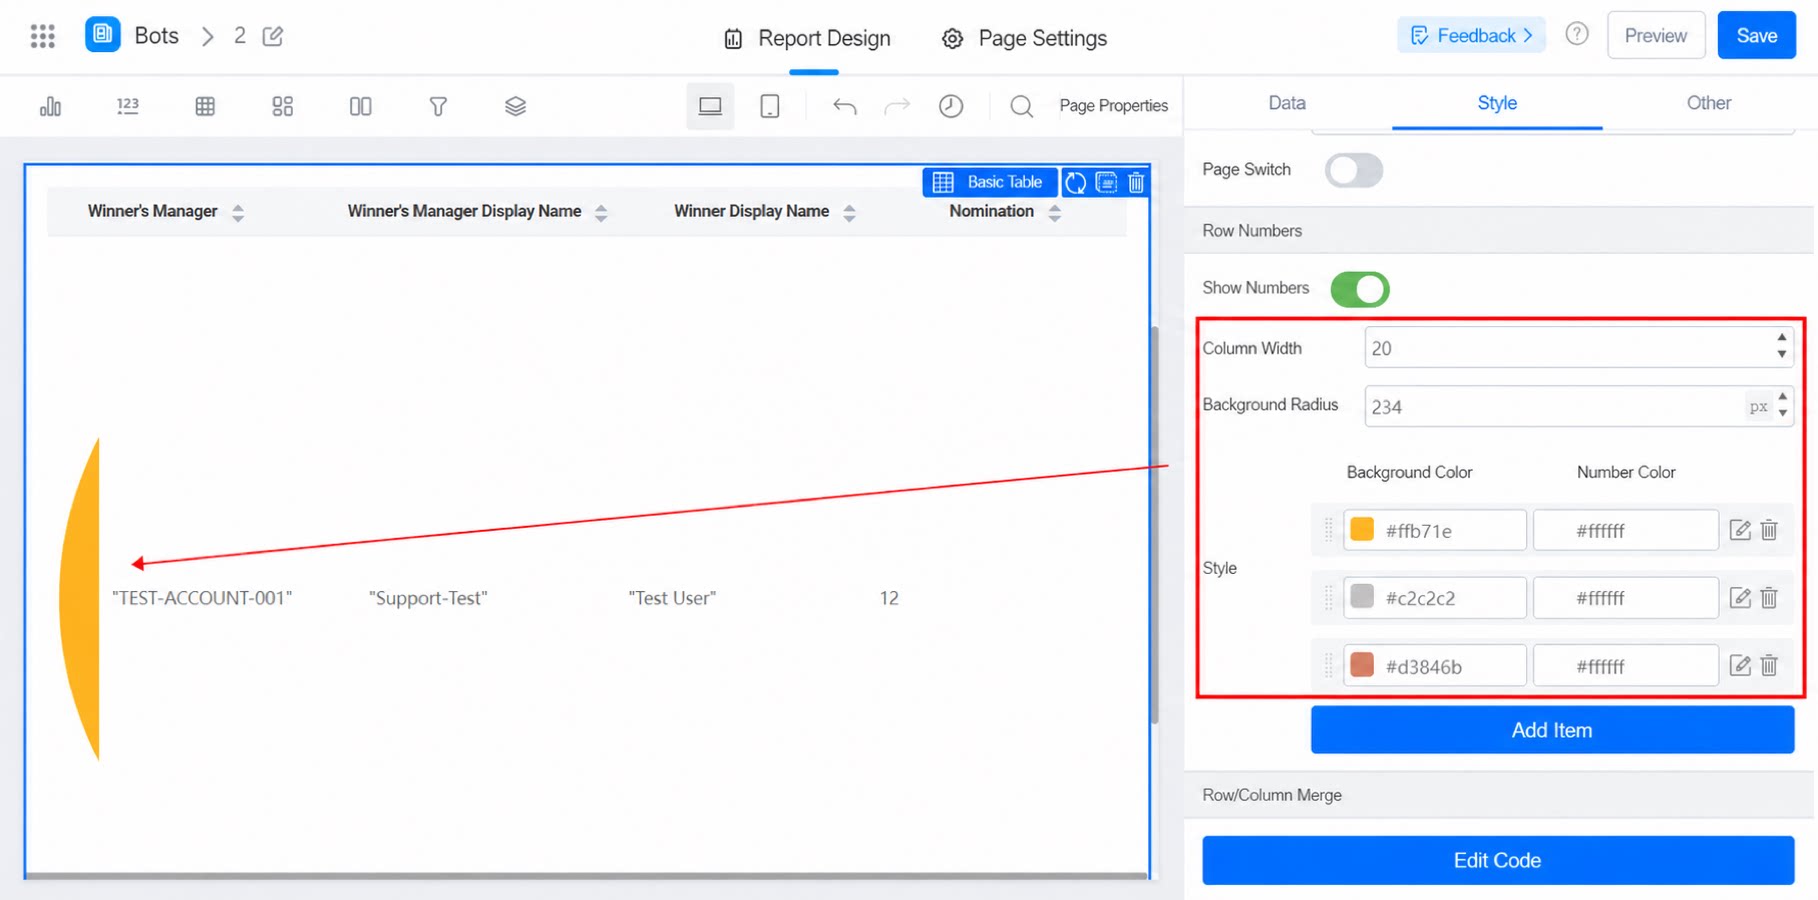
When enabled, row numbers are displayed on the far left. This is a display-only style setting. To sort data, use the sort options in the data field settings panel.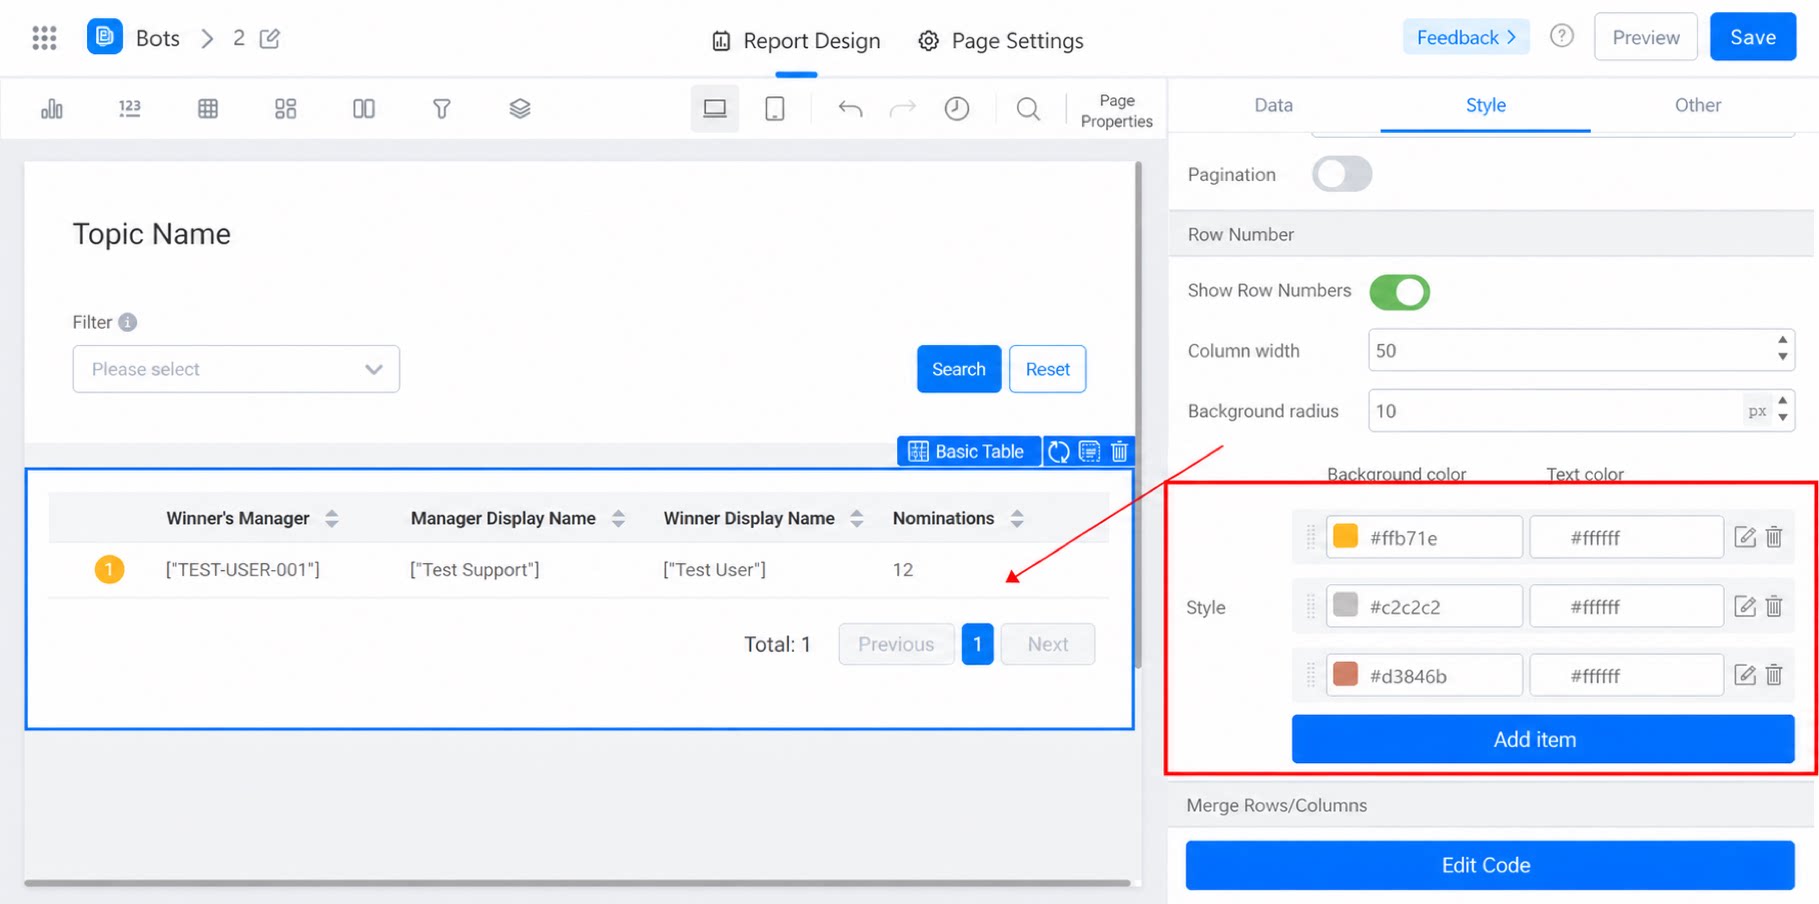
2.7 Merge Rows and Columns
Merge cells that contain identical data. The effect after configuration is shown below: Display effect. Open the code editing page. Delete symbol.2.8 Configure Image Display
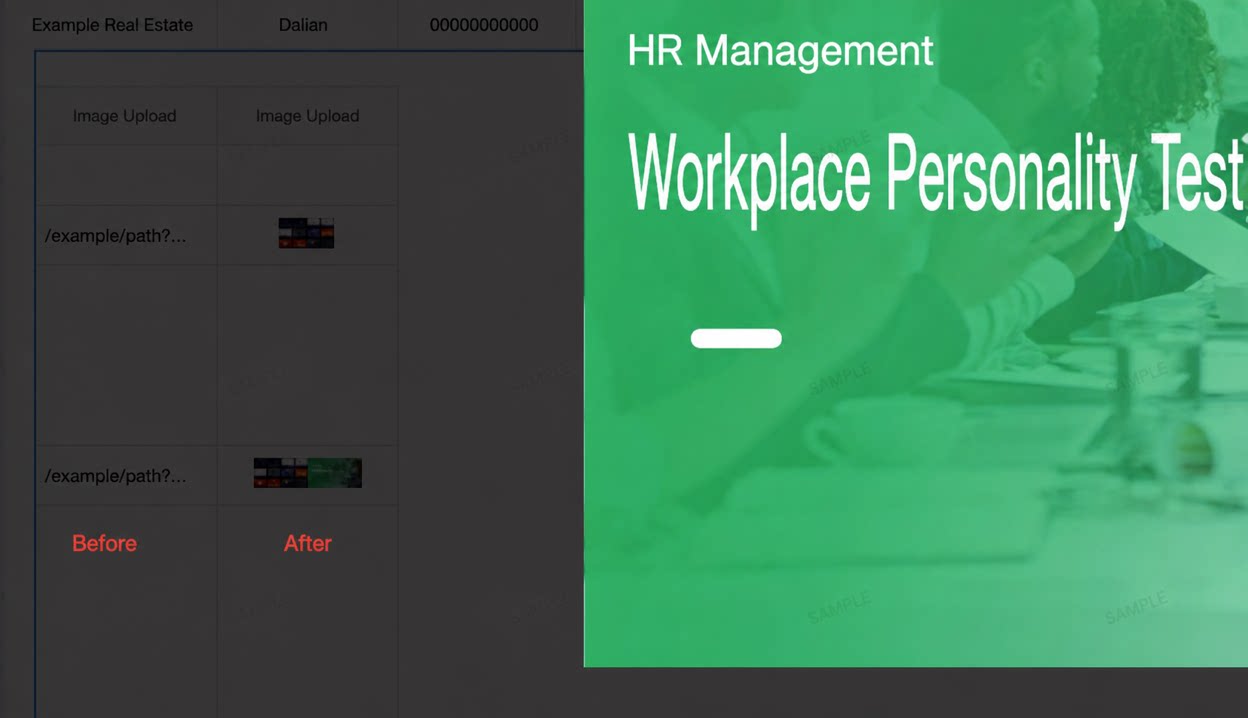
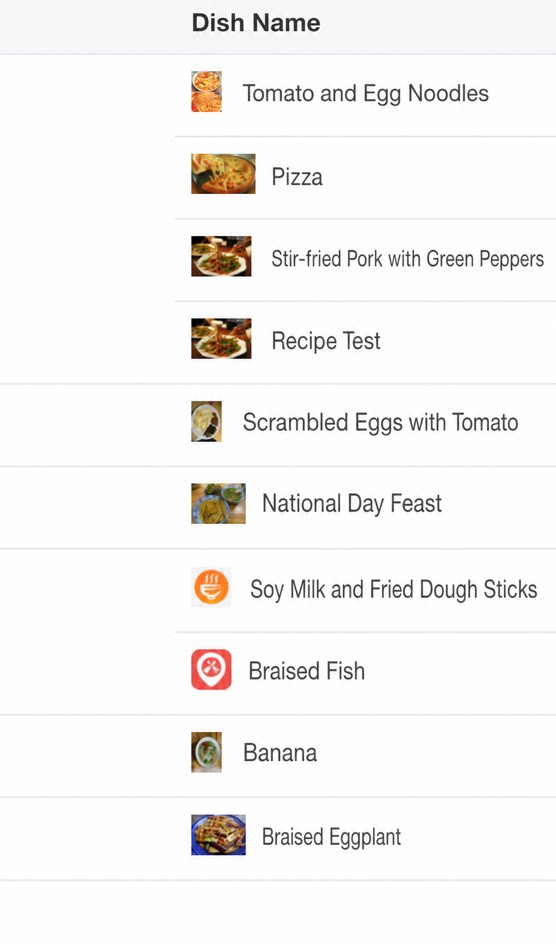
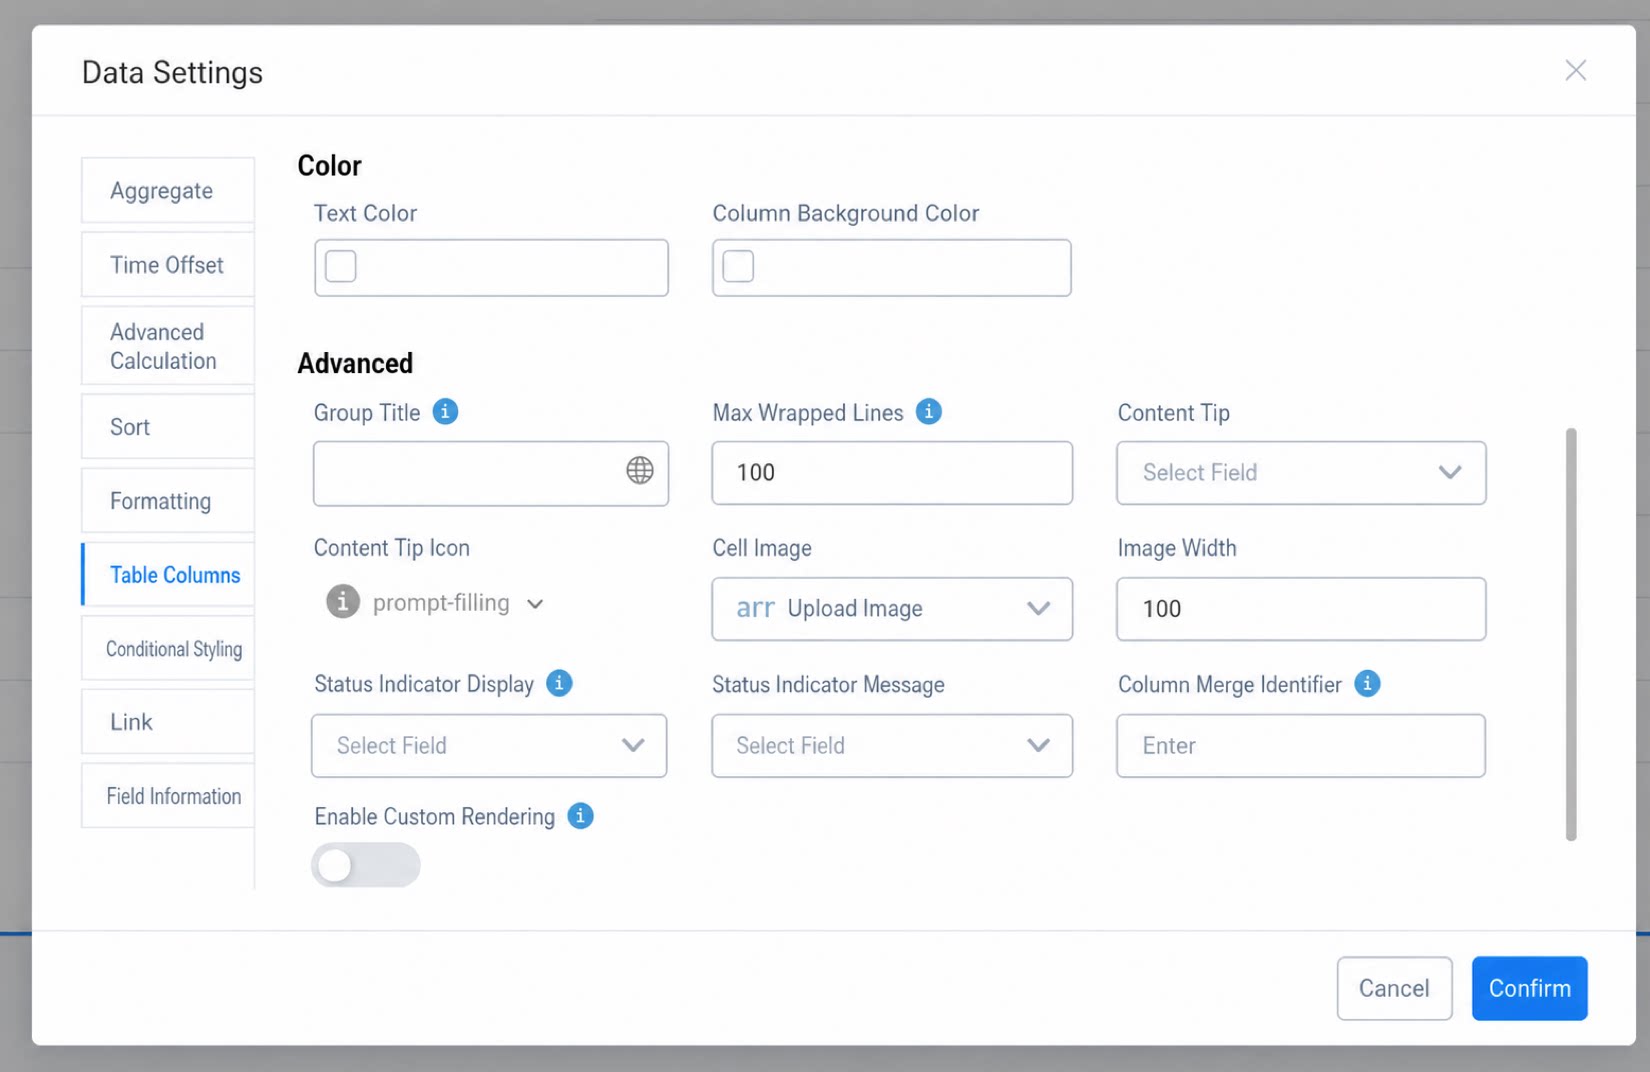
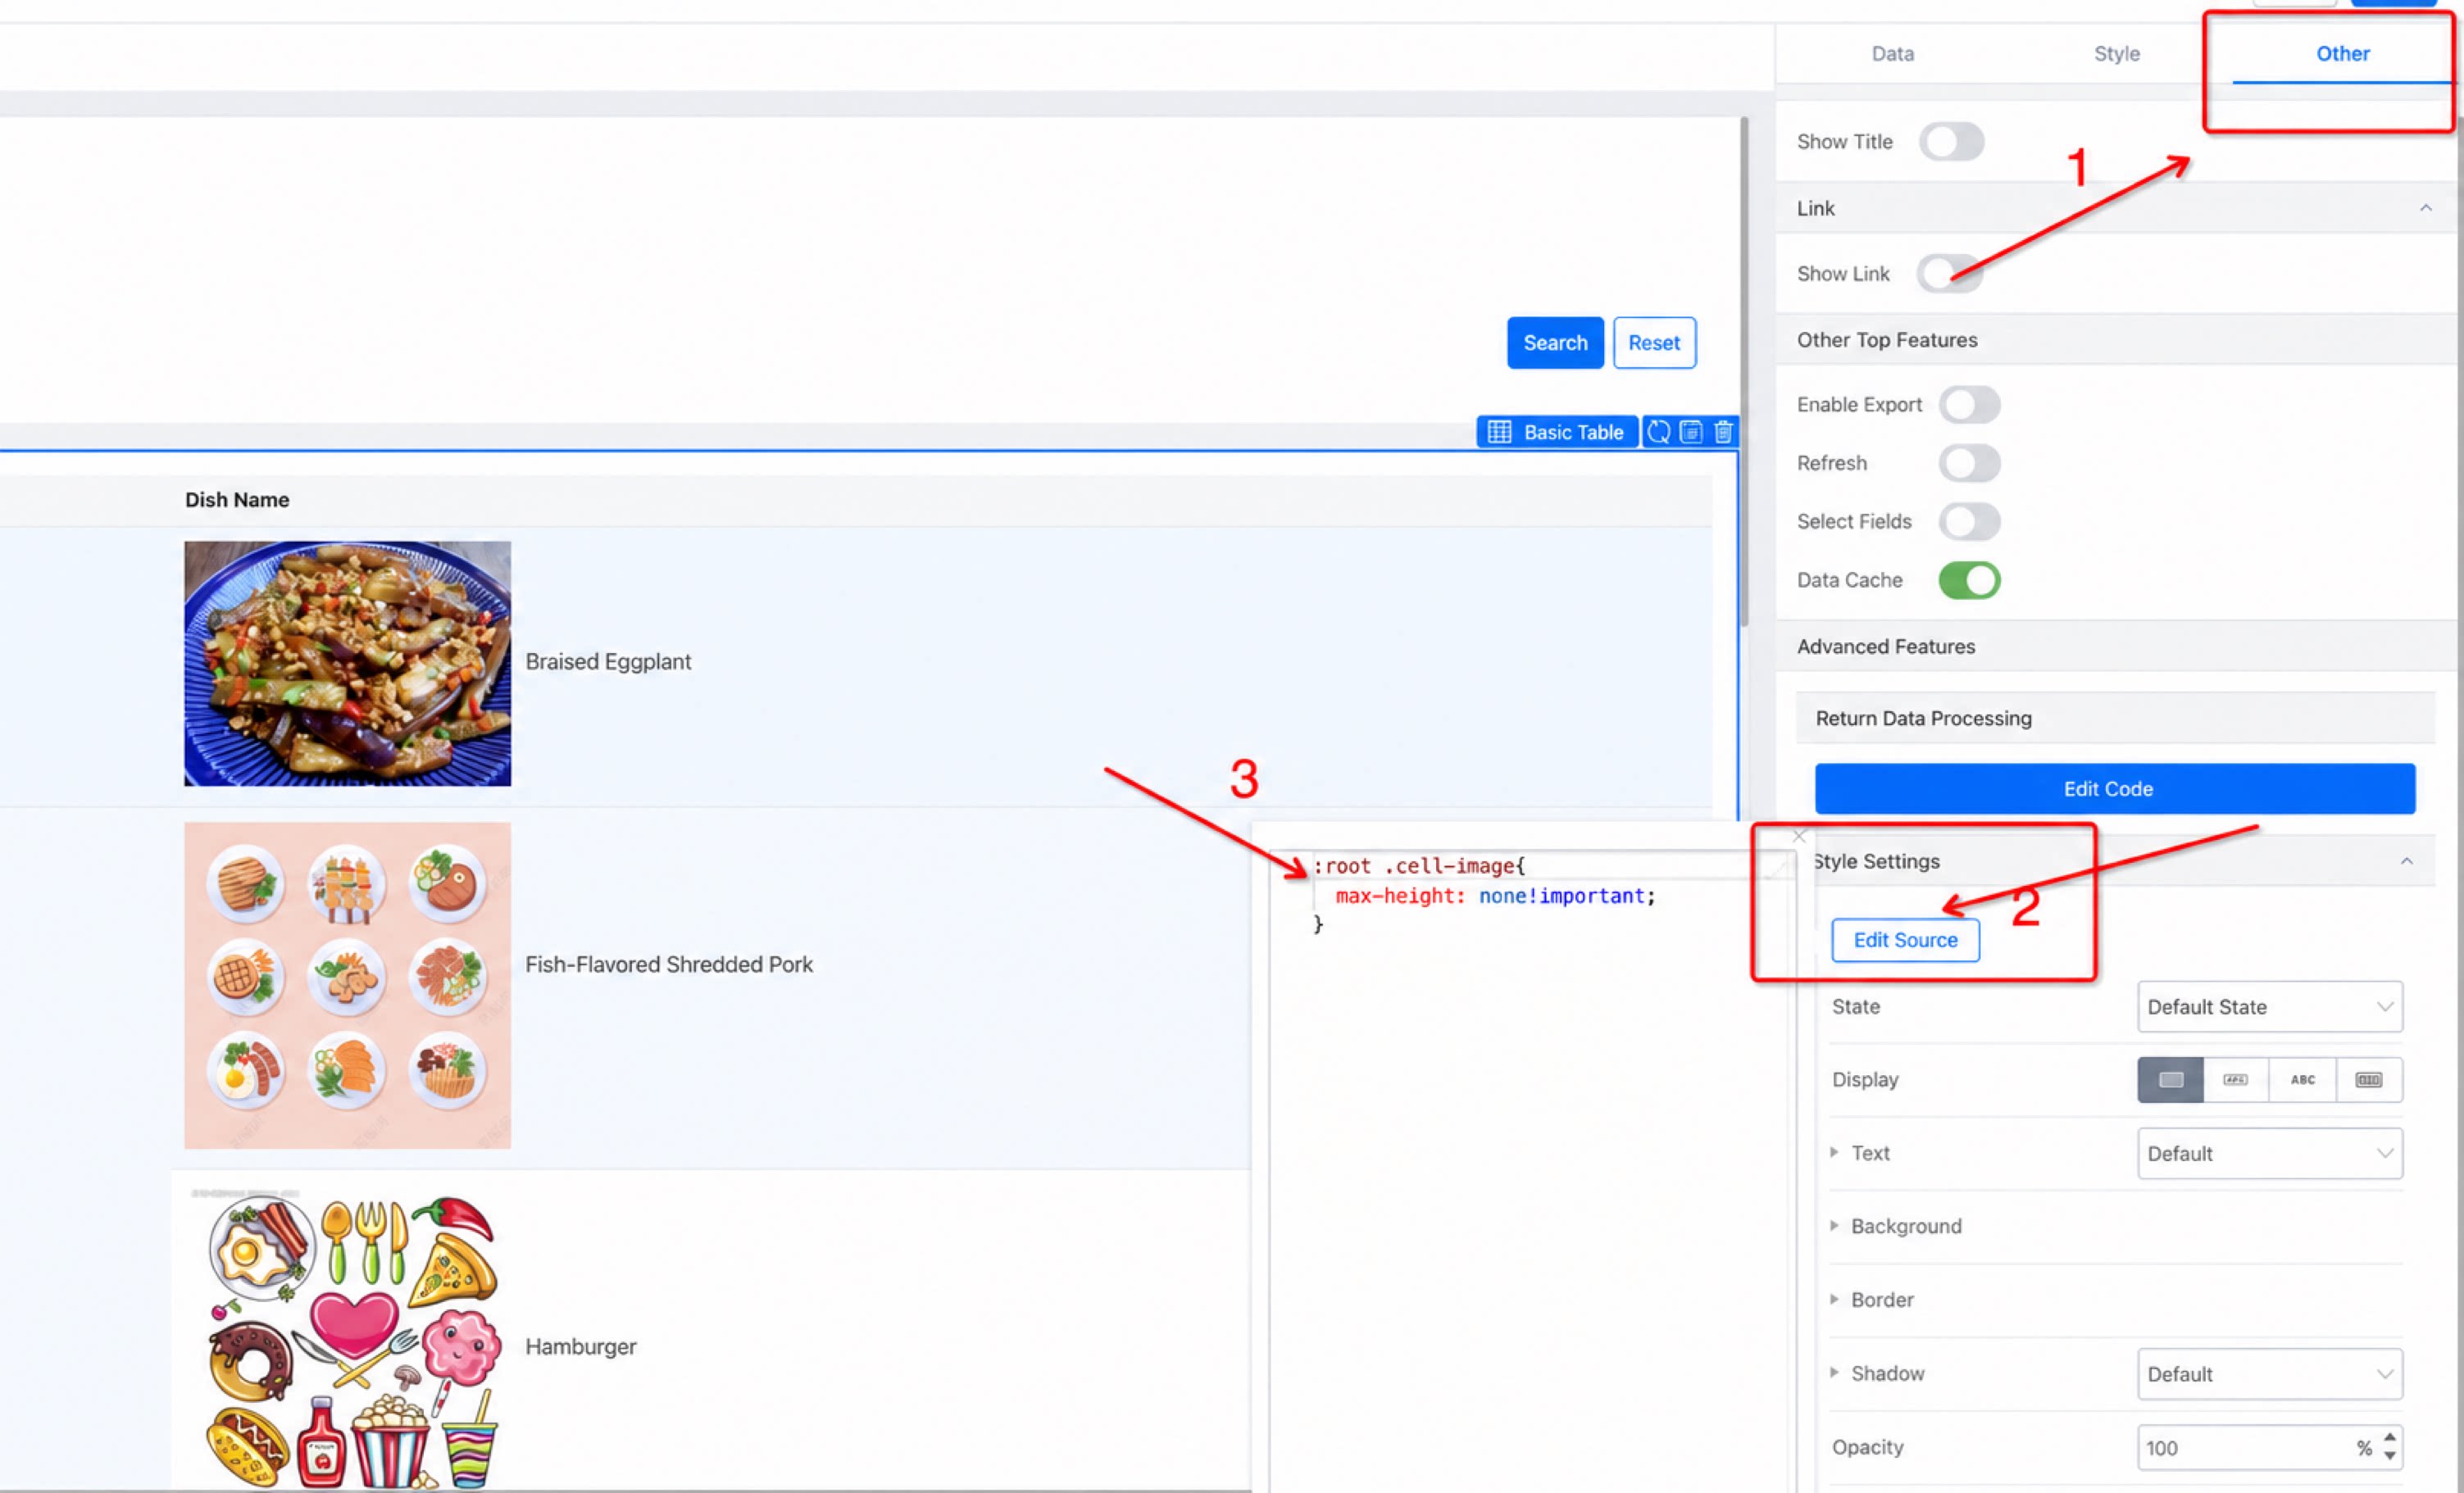
There are two ways to use images in the table:- Configure a cell image background directly on the cell. Common scenario (adjusting image size): Customize the image size by setting the image width together with cssheight.
 |   |
|---|
- Combine with the Image component in the form and select the image field in the table for automatic display (supported since Report 2.0).